--- 7 ---
H 45MR
H 45MA
150
100
50
1.0
0
150
0.54
1.00
100
0.96
102
1.20
130
B
C
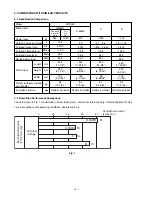
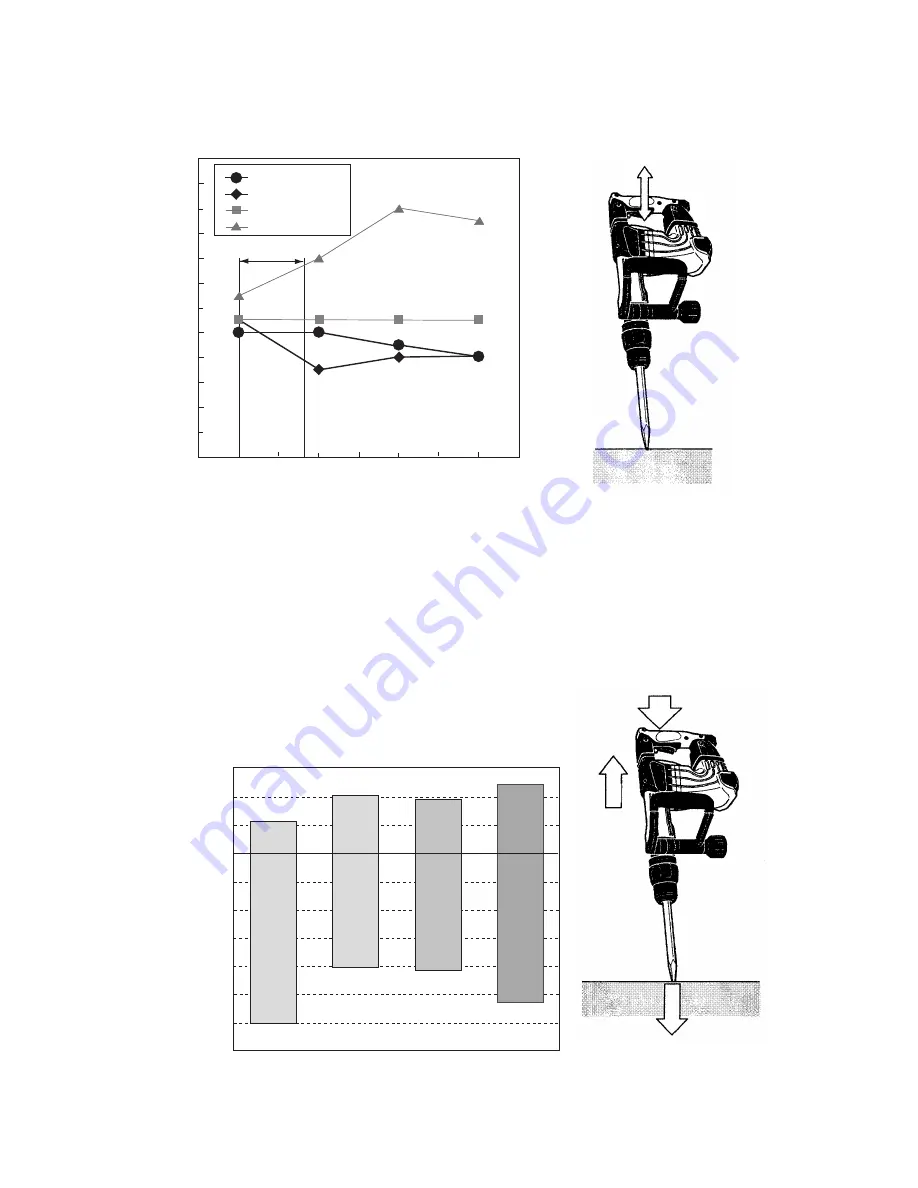
6-3. Full-load Vibration Level Comparison
The graph shown in Fig. 2 illustrates the relationship between handle pressing force and handle vibration level in
the Z direction.
Fig. 2
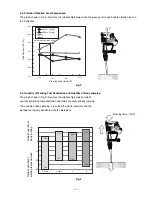
6-4. Quantity of Working Tool Penetration and Quantity of Body Jumping
The graph shown in Fig. 3 illustrates the relationship between ratio of
quantity of working tool penetration and ratio of quantity of body jumping.
The quantity of body jumping is less than the similar products and the
working tool quickly penetrates into the workpiece.
Pressing force: 100N
Fig. 3
Ratio of quantity of
working tool penetration
Ratio of quantity of
body jumping
Z
HITACHI H 45MR
HITACHI H 45MA
B
C
100
150
200
250
Normal pressing force range
Pressing force (load) (N)
114.0
116.0
118.0
120.0
122.0
124.0
126.0
Vibr
ation le
v
el (dB (VL))
Содержание H 45MR
Страница 26: ......


