Performance and curves diagrams
Domestic air conditioner
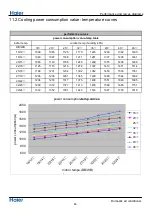
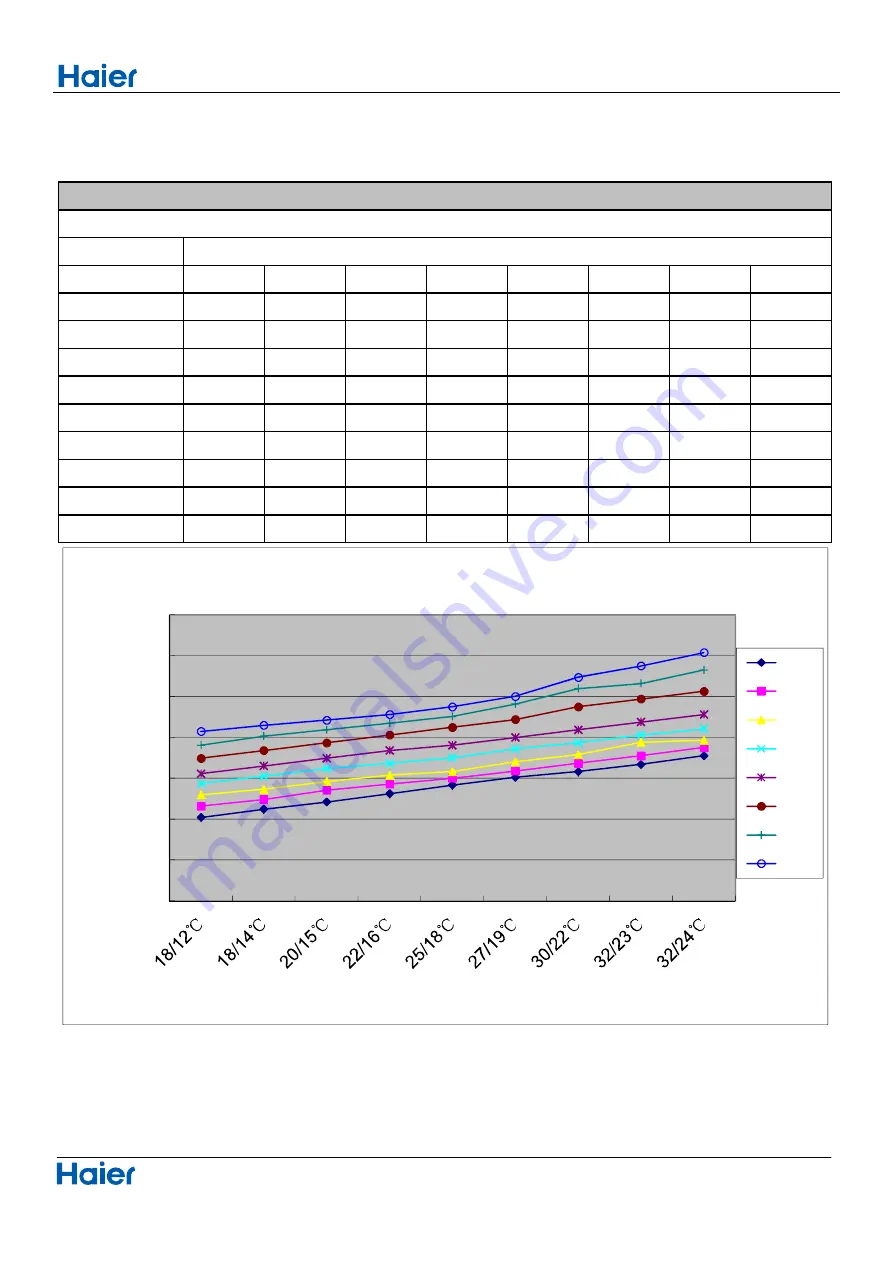
11.2 Cooling power consumption value- temperature curves
49
indoor temp.
DB/WB
18
℃
20
℃
25
℃
32
℃
35
℃
40
℃
43
℃
46
℃
18/12
℃
1009
1065
1120
1175
1223
1299
1362
1430
18/14
℃
1049
1097
1148
1211
1261
1337
1408
1461
20/15
℃
1085
1143
1186
1249
1299
1375
1438
1486
22/16
℃
1125
1173
1216
1274
1337
1413
1471
1514
25/18
℃
1168
1201
1234
1302
1362
1450
1503
1551
27/19
℃
1206
1236
1281
1345
1400
1488
1564
1602
30/22
℃
1234
1274
1317
1375
1438
1551
1640
1695
32/23
℃
1269
1312
1377
1413
1476
1589
1665
1751
32/24
℃
1312
1352
1387
1443
1514
1627
1730
1816
outdoor temp.(humidity 46%)
power consumption value-temp.table
performance curves
600
800
1000
1200
1400
1600
1800
2000
p
o
w
e
r
co
n
su
m
p
ti
o
n
(w
)
indoor tempe.(DB/WB)
●
power consumption
-temp.curves
18
℃
20
℃
25
℃
32
℃
35
℃
40
℃
43
℃
46
℃
Содержание 1U18REJFRA
Страница 11: ...Pinping diagrams Domestic air conditioner 4ˊPiping diagrams 9 EEV EEV ...
Страница 12: ...Operation range Domestic air conditioner 5 Operation range 10 10 0 21 27 35 20 40 60 43 20 40 ...
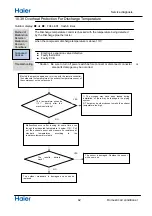
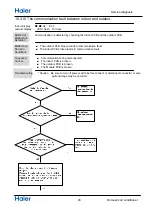
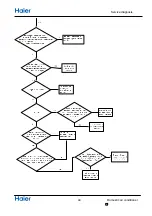
Страница 39: ...Service diagnosis 37 Domestic air conditioner ...
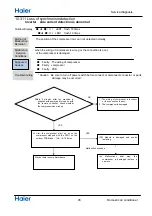
Страница 46: ...Service diagnosis 44 Domestic air conditioner ...

