36
Appendix B: Harmonic Imaging
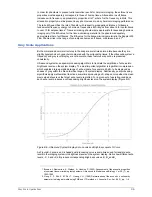
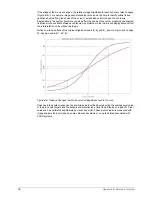
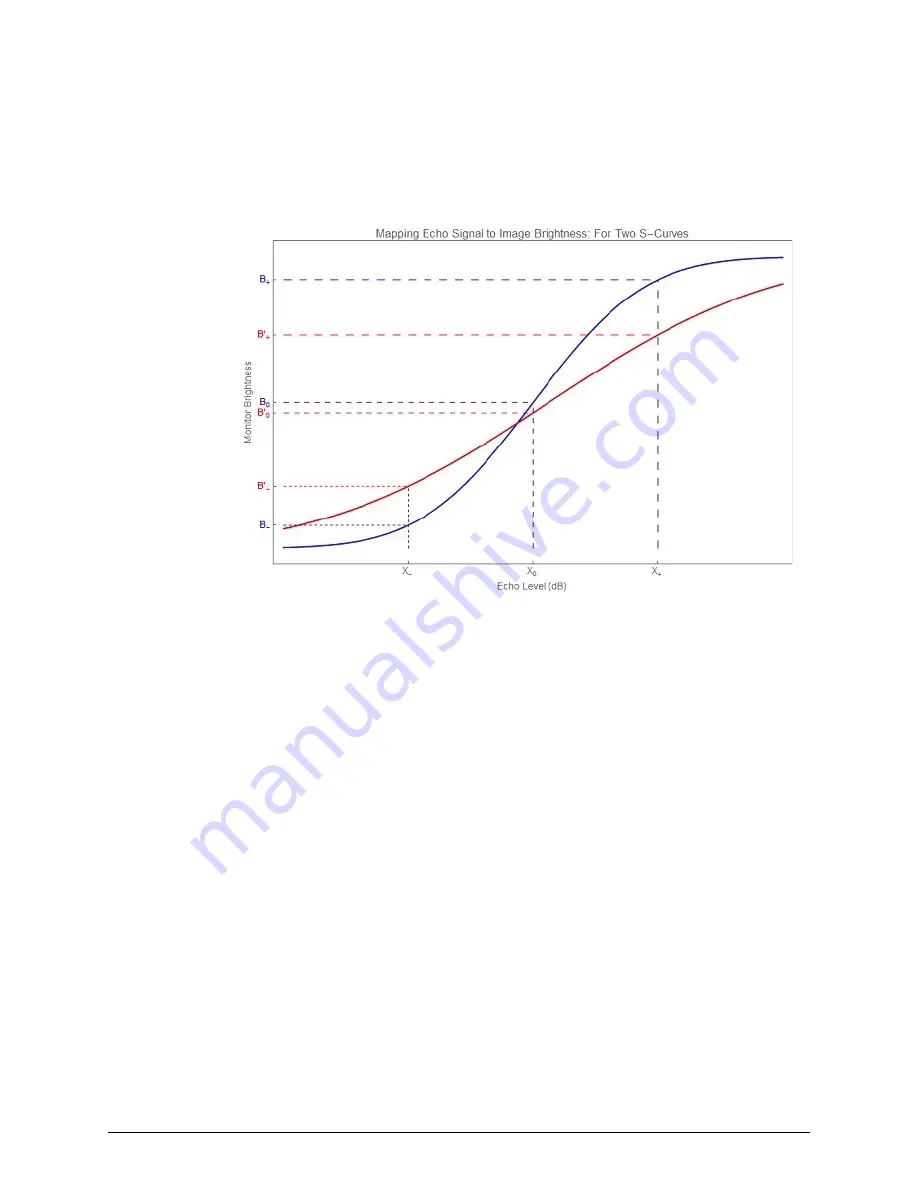
If the shape of the S-curve changes, the relative image brightness for each echo level also changes
(Figure B-6). For example, image post-processing techniques can help to identify subtle tissue
variations by modifying the shape of the curve to emphasize certain ranges of echo levels.
Degradation in the system hardware can also affect the shape of the curve, producing unexpected
variations in the contrast between echo levels. Any distortion in the information displayed may affect
the interpretation of the ultrasound image.
Notice how the positions of the original brightness levels B
-
, B
o
and B
+
, seen in Figure B-5 on page
35, have moved to B
-
1
, B
o
1
B
+
1
.
Figure B-6. Relative Changes in Echo Levels and Brightness Levels S-Curve
Changes in the system response can sometimes be identified by measuring the average pixel value
of the gray scale targets and the background material (see
on page 20). Pixel
values can be estimated qualitatively by visual inspection These pixel values are measured with
image analysis tools provided on some ultrasound systems or on workstations associated with
PACS systems.
Содержание Doppler 403 Flow Phantom
Страница 1: ...Title Doppler 403TM Flow Phantom Model 1425B...
Страница 6: ...vi Contents This page is intentionally left blank...
Страница 38: ...32 Appendix A Flow Velocity Accuracy Figure A 9 Beam Geometry and Displayed Velocity Vessel Depth Effect...
Страница 44: ...38 Appendix C Additional Reading This page is intentionally left blank...
Страница 48: ...RUSRUDWH HDGTXDUWHUV LVFRYHU ULYH 0LGGOHWRQ 86 VXQQXFOHDU FRP...


