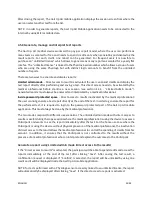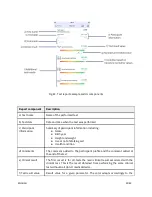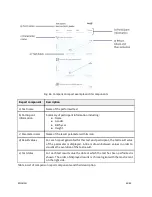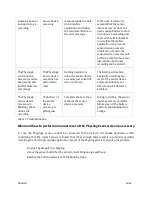
Table 5. List of report components and their description
The report can be exported by pressing the text or pdf icon on the top right hand corner. This allows
for example to send the report directly to an electronic patient folder or share the result via email.
4.5.9. Report comparison
The “History” button accessible from the participant profile screen allows to open the report
comparison view of the Gait Up GO mobile application.
For each test assigned to a specific Participant for which at least two reports have been generated, a
comparison of the results is possible. The history is available when several reports of the same test
have been generated for the same Participant. This feature allows the Healthcare Professional to have
and visualise factual data about the progression of the Participant over the time.
It is possible to export history reports into pdf or text format for sharing and sending it to a computer
or electronic patient record file.
position of the result on the colorbar. The units of the result value are also
indicated.
g) Normative
threshold value
For some result parameters, specific values are highlighted by a triangle
below the colored bar. These are threshold values which indicate interesting
reference points such as the average of the population of the same age or
physiological reference values.
h) Colorbar based on
literature normative
values
All result parameters are displayed with respect to normative data from
scientific literature. Where the color is red means that the achieved result is
poor compared to Participants of similar age and health condition (if
literature is available). Results in the green area are equal or better than the
result of similar Participants presented in the literature.
i) Additional results
Additional result parameters which are calculated thanks to Gait Up GO and
the presence of the Physilog6 sensor which records the movement data
during the test.
ENGLISH
60/84
Содержание GAIT UP GO
Страница 34: ...10 A LPHABETICAL INDEX ENGLISH 83 84...


