


Pressing other buttons on the back panel will not turn on the backlight.
3.) When a power outage occurs, the unit will switch to battery power automatically. The display
backlight will be off, and will only light when you press the LIGHT/SNOOZE button to check clock
and temperature.
Viewing the Time Zone
In clock display mode, tap the TIME ZONE button repeatedly to view the time in different time zones.
Changing the Temperature Display format
In clock display mode, press and hold the °C /°F button on back panel of the main unit to change the
temperature display degrees format from Celsius (°C) to Fahrenheit (°F) mode.
Indoor Weather Measurement
The indoor temperature and humidity is displayed in the Temperature Window on the main unit display.
Checking & Deleting the Max/Min Temperature Record
1. Tap the MAX/MIN button on back panel once to check the maximum temperature and humidity record. Tap
it twice to check the minimum record. Tap it again to exit.
2. Maximum and minimum temperature and humidity records will be deleted automatically at 12:00 AM
everyday.
Comfortable level Indicators
The three comfortable weather icons below represent the current comfort levels (Dry, Comfort and Wet) of
the room the SFA2200 is placed in.
1. No matter what the temperature is, when the humidity is under 40%, the display will show the DRY icon.
2. When temperature is between 68°F (20°C) and 77°F (25°C), and when humidity is between 40% and
70%, the display will show the COMFORT icon.
3. No matter what the temperature is, when the humidity is higher than 70%, the display will show the WET
icon.
DRY COMFORT WET
NOTE:
When temperature is between 68°F (20°C) and 77°F (25°C),
and the humidity is
between 40% and 70%, no icon will be displayed.
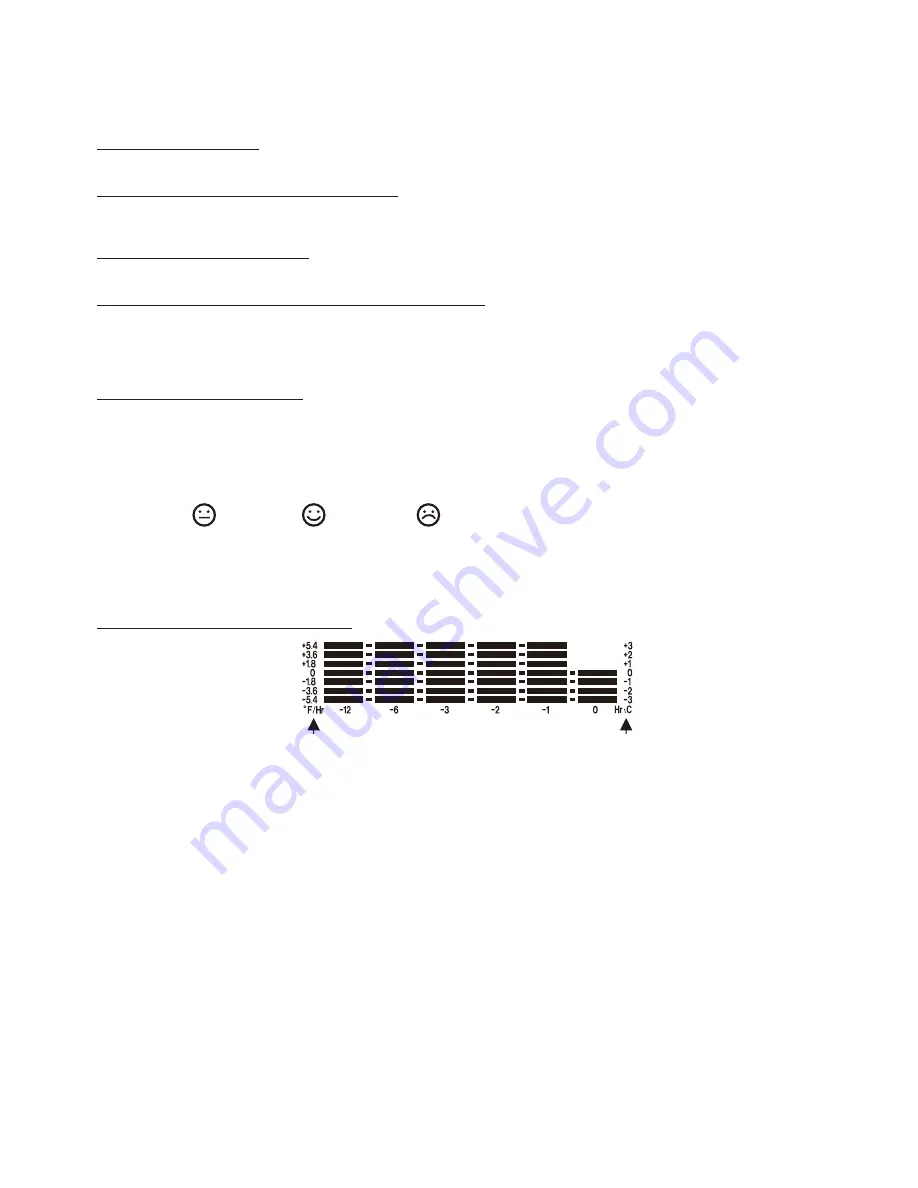
Temperature Trend of past 12 hours
Dynamic BAR graph trend of indoor temperature for the past 12 hours
This unit is equipped with a dynamic temperature trend feature for the past 12 hours. It moves from right to
left to indicate the temperature changes by comparing the past hour temperature to the current
temperature. Maximum range is up to +/- 5.4 °F (+/- 3 °C) at past 1, 2, 3, 6 and 12 hours.
How to read temperature trend
1. Horizontal scale of 0, -1, -2, -3. -6 & -12 mean current time (0), past 1, 2, 3, 6 & 12 hour respectively.
2. Vertical Scale of +/- 5.4, 3.6, 1.8, 0 degree
°F (+/- 3, 2, 1, 0 degree °C) mean temperature changes
compared to current temperature.
3. The unit will detect temperature
trends automatically and needs at least one hour before it can start
displaying the temperature changes. It’s recommended to begin reading the trend after the unit is on and
working for 12 hours or longer.
4. As time passes, the display will show the temperature rising or falling trend by turning the bars ON/OFF
automatically based on past 12 hour temperature readings.
Note:
1.) One lighting bar scale = 1.8 °F (1°C).
2.) If the temperature change e/-3°C,
a full BAR graph or 1 BAR graph will be displayed.
3.) The temperature trend is calculated by changes in the temperature and is indicative only. The
calculation can be affected by many things including where the unit is placed.
4.) The unit is for indoor use only. There are no guarantees for the accuracy when using this unit for
forecasting outdoor weather conditions.
Degree Fahrenheit/Past hour
Degree Celsius/Past hour
-6-


