

MPANT Software
ComTec GmbH
6-5
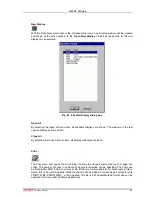
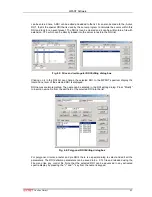
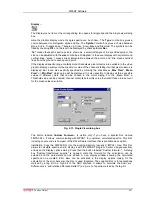
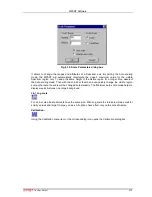
Window list
At the end of the Window menu, all created Display windows are listed with their names, the
current active window is checked. By selecting any of the names, this window becomes the active
window and is displayed in front of all the others.
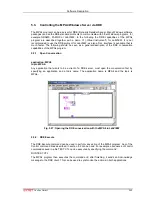
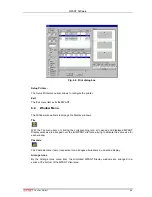
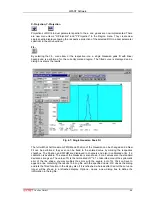
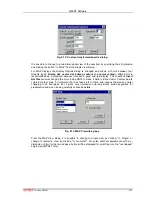
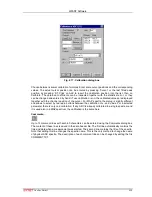
6.3. Region
Menu
The Region menu contains commands for Regions and ROI's (Regions of Interest). A Region can
be defined by marking it in a display, with the mouse using the right mouse button and dragging a
rectangle over the area one is interested in. A ROI, i.e. an already defined region in a single
spectrum can be shown zoomed by double-clicking with the left mouse button on the
corresponding colored area in the bar at the bottom of the spectra display. A single mouse click
with the left button on the corresponding colored area makes this to the selected ROI and lets the
counts contained in this ROI be displayed in the information lines of the respective window.
Advance the selected ROI to the next or previous one using the "+" or "-" key from the numeric
keypad.
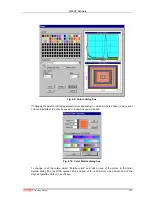
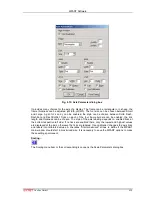
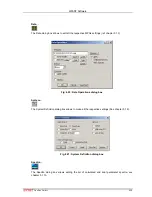
Polygonal and curved ROI's in MAP displays are now implemented in addition to the rectangular
ROI's. The boundaries can be polygonal, circular, annular or pie. Make a choice of the shape
using the Menu Region...Shape or the corresponding toolbar icon. Define the ROI using the right
mouse button, the TAB and the END key (please read the help in the status bar) and save the
ROI using the toolbar icon "Create new ROI". Advance the selected ROI to the next or previous
one using the "+" or "-" key from the numeric keypad. The ROI boundary is displayed by lines or
circles and the ROI area can in addition be displayed in inverted color by enabling the checkbox
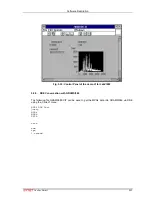
"Invert ROI Pixel" in the MAP Display options dialog. The sum and net sum of counts within the
selected ROI is displayed. The net sum is calculated by subtracting a background integral by
summing line integrals S(y) for each y coordinate using the mean value of the counts at the
lowest and highest x coordinate of the ROI.
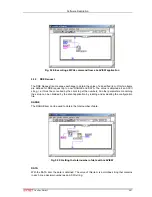
Zoom
The Zoom item or respective icon enlarges a Region to the maximum Spectrum Display size.
Back
The Back menu item or clicking the corresponding icon restores the last zoom view. Each time a
Back command is clicked the view is stepped back one step.
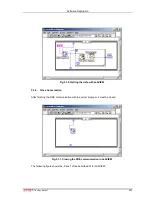
Zoom Out
The Zoom Out menu item or clicking the corresponding icon enlarges the actual zoom view by a
factor 2, if possible.
Home
Clicking the Home menu item or the corresponding icon restores a Display to the basic
configuration.
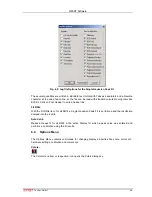
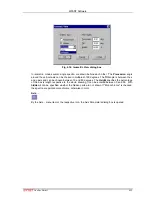
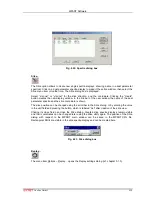
Shape
Selecting the Shape menu item opens a submenu with the items Rectangle, X-Slice Y-Slice and
Rectangle, Polygon, Circle, Annular and Pie to choose the ROI shape.