


RHT10 HW_SW-en-US_V5.6.2 6/16
9
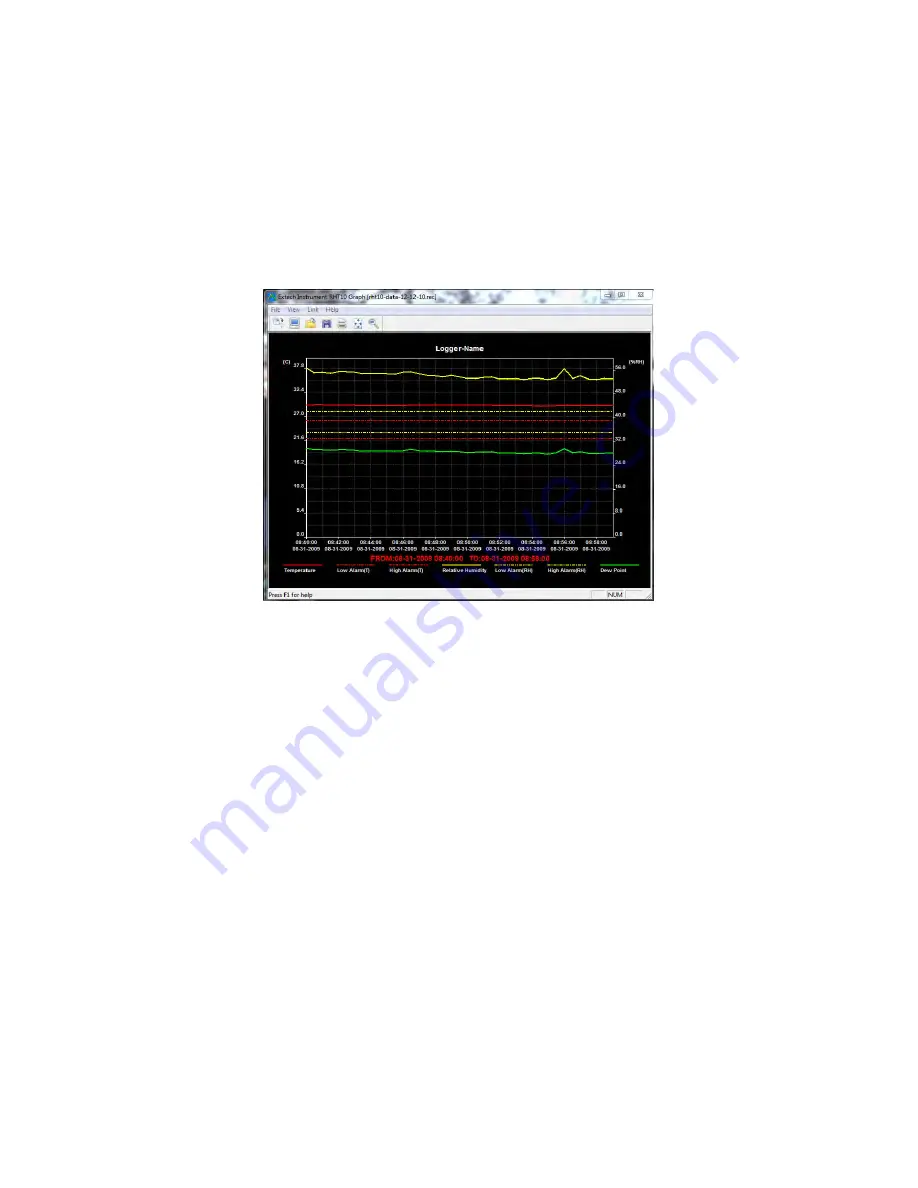
When
VIEW
is
pressed,
the
Data
Graph
window
appears,
The
Data
Graph
window
presents
the
transferred
data
in
an
x
‐
y
graph
format
with
Date/Time
represented
on
the
horizontal
axis
and
Temperature
/
Relative
Humidity
/
Dew
Point
/
Grains
per
pound
GPP
(with
optional
RHT10
‐
SW
only)
/
Alarm
Limits
represented
on
the
vertical
axis:
To
zoom
in
and
out
of
data
regions,
there
are
several
approaches:
1.
Use
the
mouse
to
click
and
drag
a
box
around
any
data
area
to
magnify
the
selected
area.
2.
Click
on
the
zoom
magnifier
icon
tool
on
the
menu
bar
3.
Select
VIEW
ALL
or
ZOOM
OUT
from
the
VIEW
pull
‐
down
menu.
In
the
example
graph
above,
the
Temperature
is
represented
by
the
solid
red
line
(the
lines
are
known
as
‘traces’);
the
RH
and
Dew
Point
are
represented
by
the
solid
yellow
and
green
lines,
respectively.
The
low
and
high
alarm
values
for
temperature
are
represented
by
the
dashed
red
traces;
the
corresponding
alarms
for
humidity
are
represented
by
the
dashed
yellow
traces.
www.
GlobalTestSupply
.com
Find Quality Products Online at:


