Exinda Network Orchestrator
3 Using
|
193
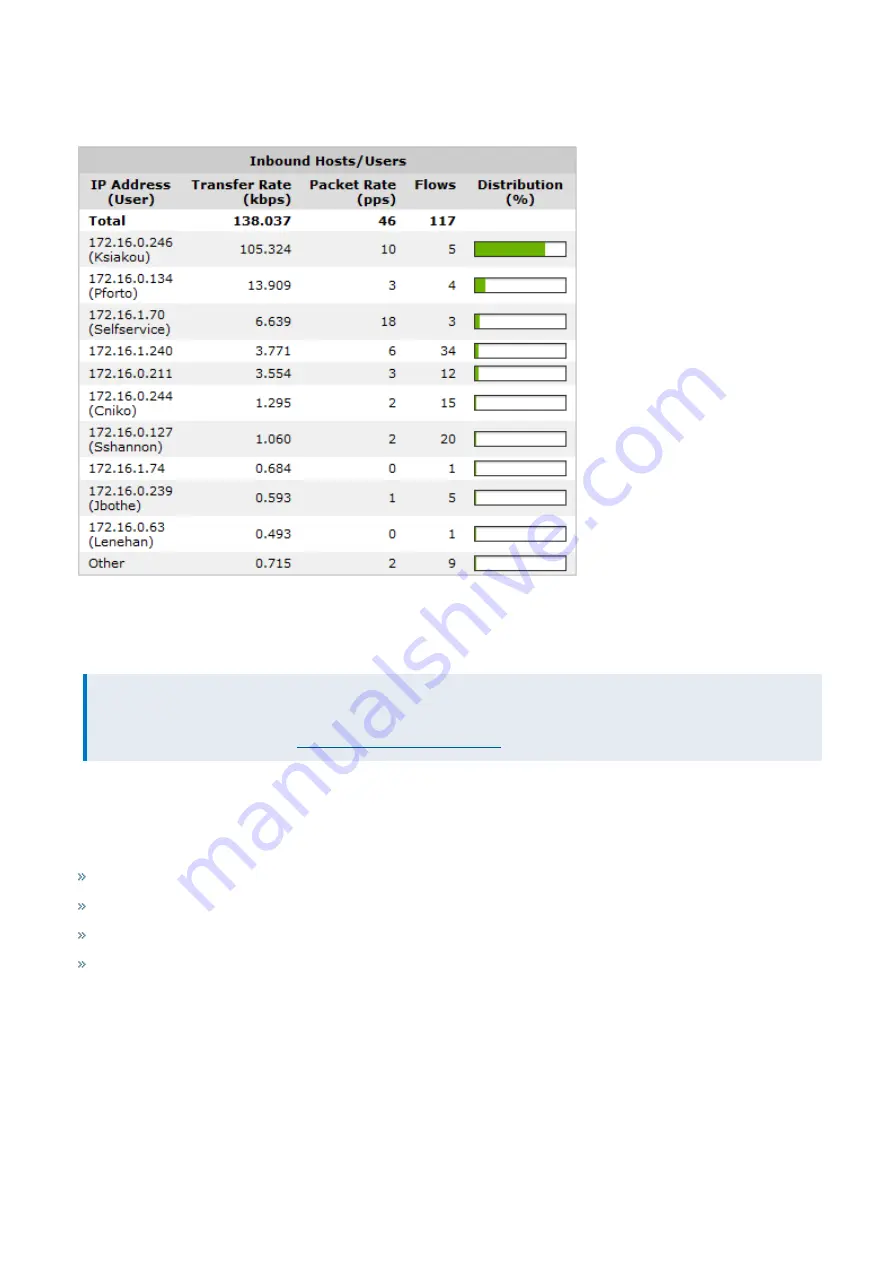
The Distribution percentage shows the proportion of bandwidth consumption of each host relative to all hosts for the
period. You can set the chart to refresh frequently or infrequently or not at all. Each refresh shows 10 seconds of data.
Screenshot 70: Monitoring inbound hosts/users report
To access this report, go to
Monitor > Real Time > Hosts/Users
.
To show the user associated with the internal hosts, check the
Show Users
checkbox.
NOTE
Active Directory must be configured on the Exinda Appliances before user names can be displayed in reports. See
For more information, refer to
Integrate with Active Directory
.
Monitoring conversations in real time
The Realtime Conversations monitor shows the top conversations by throughput observed by the Exinda Appliance
during the last 10 seconds. This report answers questions such as:
My link is congested; who's doing what on my network right now?
I think I have a problem with a particular host or subnet; what is that host or subnet doing right now?
Is network traffic being accelerated or processed by Edge Cache properly?
Is network traffic passing through my High Availability or Cluster correctly?"
Inbound and outbound conversation traffic is displayed separately. Conversations are represented by external IP address,
internal IP address, and application. Some traffic types show extra information (like URL) in square brackets following the
application.
Traffic is sorted by transfer rate. The packet rate and number of flows for each conversation in the preceding 10 second
period is shown. You can set the chart to refresh frequently or infrequently or not at all. Each refresh shows 10 seconds of
data.
The Realtime Conversations monitor helps you diagnose issues by:
Содержание EXNV-10063
Страница 98: ...Exinda Network Orchestrator 2 Getting started 98 6 Click New The New Virtual Hard Disk wizard opens ...
Страница 99: ...Exinda Network Orchestrator 2 Getting started 99 7 Select VHDX as the Disk Format type and click Next ...
Страница 130: ...Exinda Network Orchestrator 2 Getting started 130 Screenshot 35 The life cycle of configuration status ...
Страница 369: ...Exinda Network Orchestrator 4 Settings 369 ...
Страница 411: ...Exinda Network Orchestrator 4 Settings 411 Screenshot 168 P2P OverflowVirtualCircuit ...
Страница 420: ...Exinda Network Orchestrator 4 Settings 420 Screenshot 175 Students OverflowVirtualCircuit ...
Страница 451: ...Exinda Network Orchestrator 4 Settings 451 ...

