


15
2.4 Dashboard
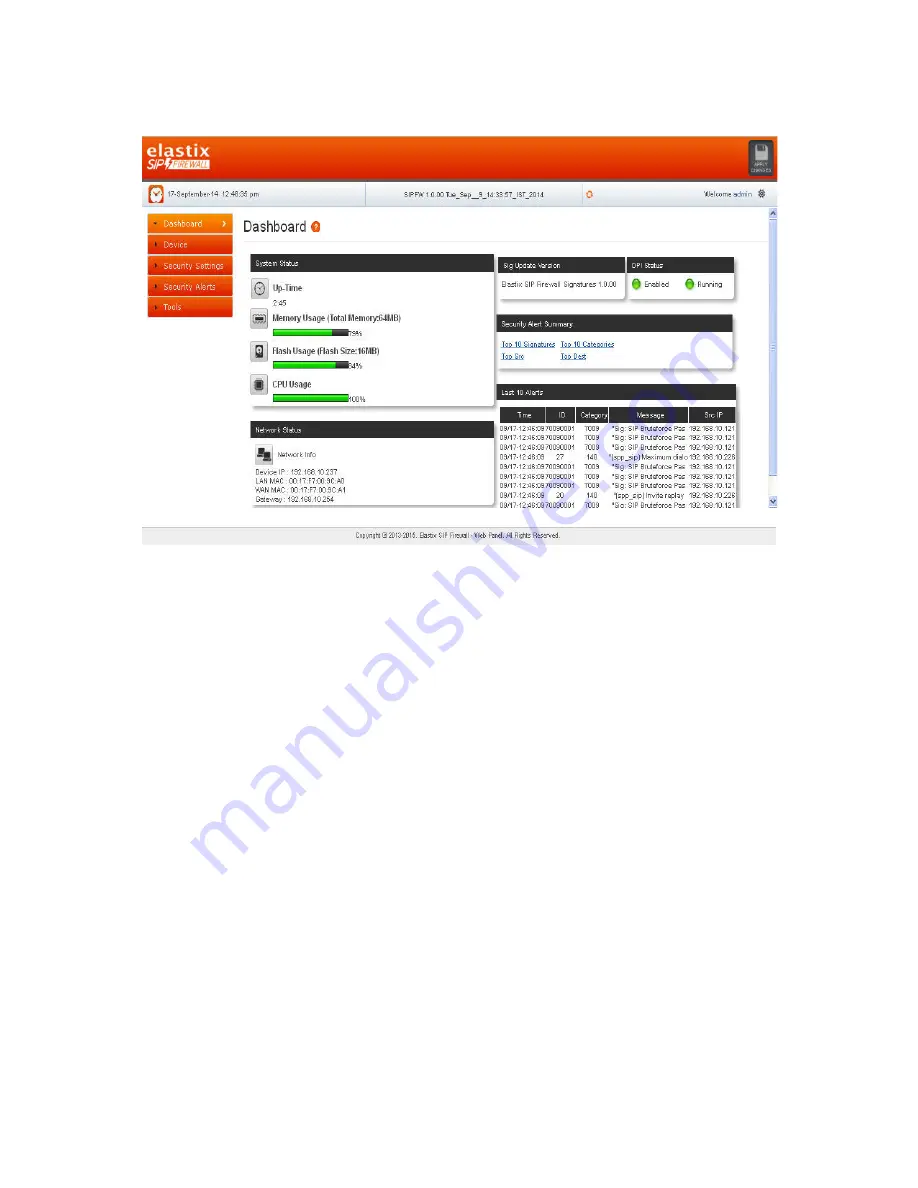
Figure 8: Dashboard
On logging into the SIP Firewall WebUI, the dashboard will be shown.
The user can visit the dashboard page from the any configuration page in the SIP Firewall
WebUI, by clicking the SIP Firewall Product Icon that appears in the left corner of the Top
panel.
The status panel that appears below the top panel shows the time settings on the device
and SIP Firewall firmware version, Page refresh icon and Setting icon.
On clicking the page refresh button, the main content area in the current page will be
refreshed.
On clicking the settings icon, the pop menu which contains menu options logout, WebUI
settings will be shown.
System Status Panel shows Device up time, Memory Usage, Flash Usage & CPU Usage.
Sig Update Version Panel shows the SIP Firewall Signature version and Release State.
Network Status Panel shows IP, LAN MAC, WAN MAC and Gateway of the device.
Security Alert Summary Panel shows hyperlinks for viewing of Top 10 Signatures hit, Top
10 Categories hit, Top Attacker IP Addresses & Top 10 target destinations.
Содержание SIP Firewall
Страница 1: ......
Страница 2: ...Elastix SIP Firewall User Manual ...
Страница 23: ...21 Figure 15 Logging ...
Страница 33: ...31 Figure 25 Geo IP Filters ...


