15
IV – Menus
2.
Launch a planned dataset
A planned dataset is composed of several locations. For each location, the operator can enter a theorical value and a tolerance for the
parameter to be controlled. Planification must be made via the software.
a
. Click on
OK
or
to enter into sub function.
b
. Select
Planned
with
and
. Confirm wih
OK
.
c
. Choose dataset name
with
and
. Confirm wih
OK
.
d
. Select the location with
and
. Confirm wih
OK
.
3. Preview of dataset graphic
a.
Go to
Recording
menu.
b.
Select
Display
. Click on
OK
to validate.
c.
Select dataset name with arrow keys
and
. Click on
OK
.
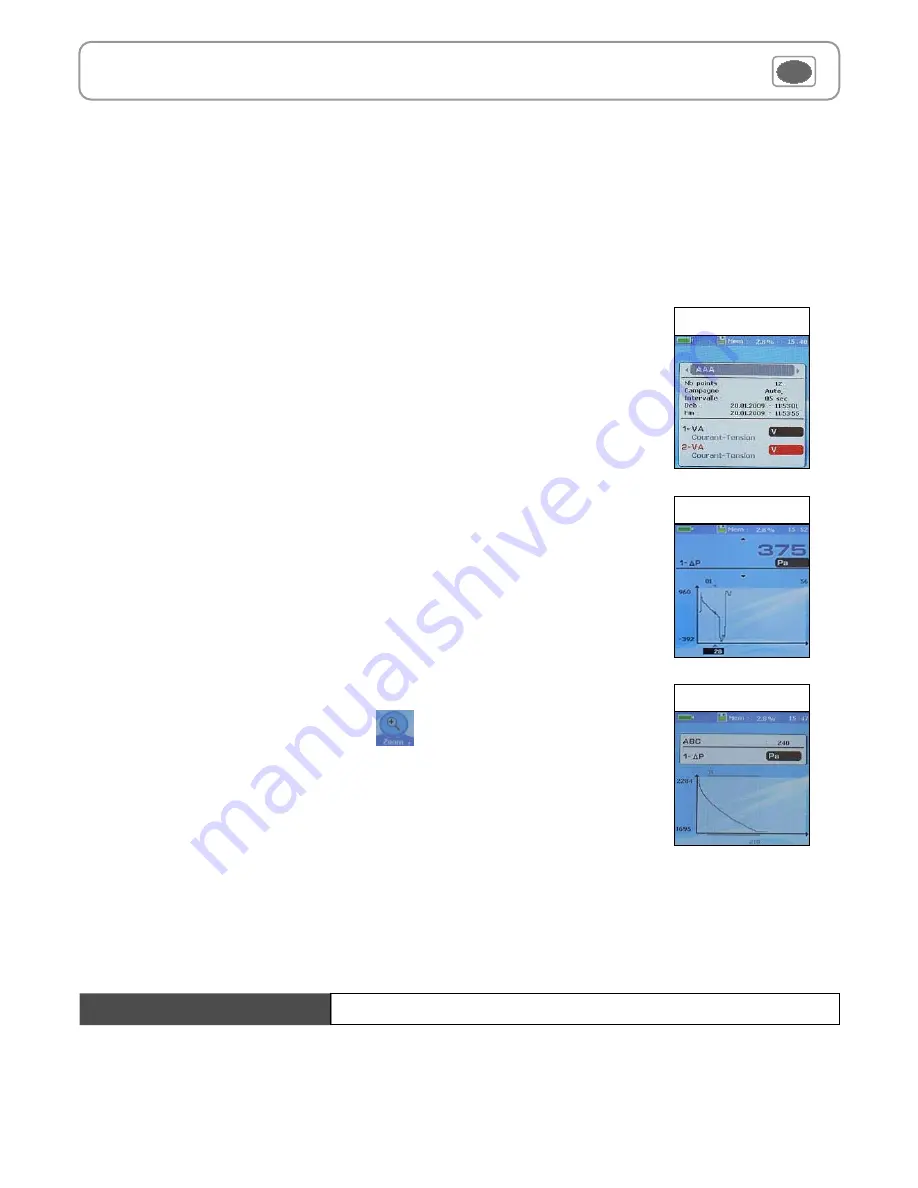
Summary screen of selected dataset is displayed. From this screen, you can :
●
Select other dataset using arrow keys
and
.
●
Dislplay data of other channels using arrow keys
and
.
d.
Click on
OK
to display selected dataset graph.
From this screen you can :
●
Browse on the curve with arrow keys
and
to display values of pionts.
●
Select the channel using arrow keys
and
.
You can display a graph of datasets performed on the device.
Note
: if selected dataset has more than 180 points, the device will display a global view of dataset. To
zoom on a dataset part, use arrow keys and press
key.
The device displays graph of the interval of selected points.
Dataset summary
Dataset graph
Global graph of
dataset
4. Delete all datasets
Select
Delete
with
and
. Confirm wih
OK
.
see DataLogger-10 user manual chapter
III – Read device
page 6.
Downloading data


