• The
Time axis
box is used to define the minimum and maximum values of the horizontal axis. If the
Use OP-
TIMAL zooming range
checkbox is selected, these values will be set to display all data currently in memory.
• The
Y-Axis
box is used to define the minimum and maximum value of the vertical axis. If the
Synced zoom
on all Y-Axis
checkbox is selected, these values can be changed. This only allows the
Voltage
axes to be
changed, to the same value for all. The
Use OPTIMAL zooming range
will set the axes to a value displaying
all data points in memory.
• The
Modify
button will apply any changes to the axis values. The
Cancel
button cancels all changes.
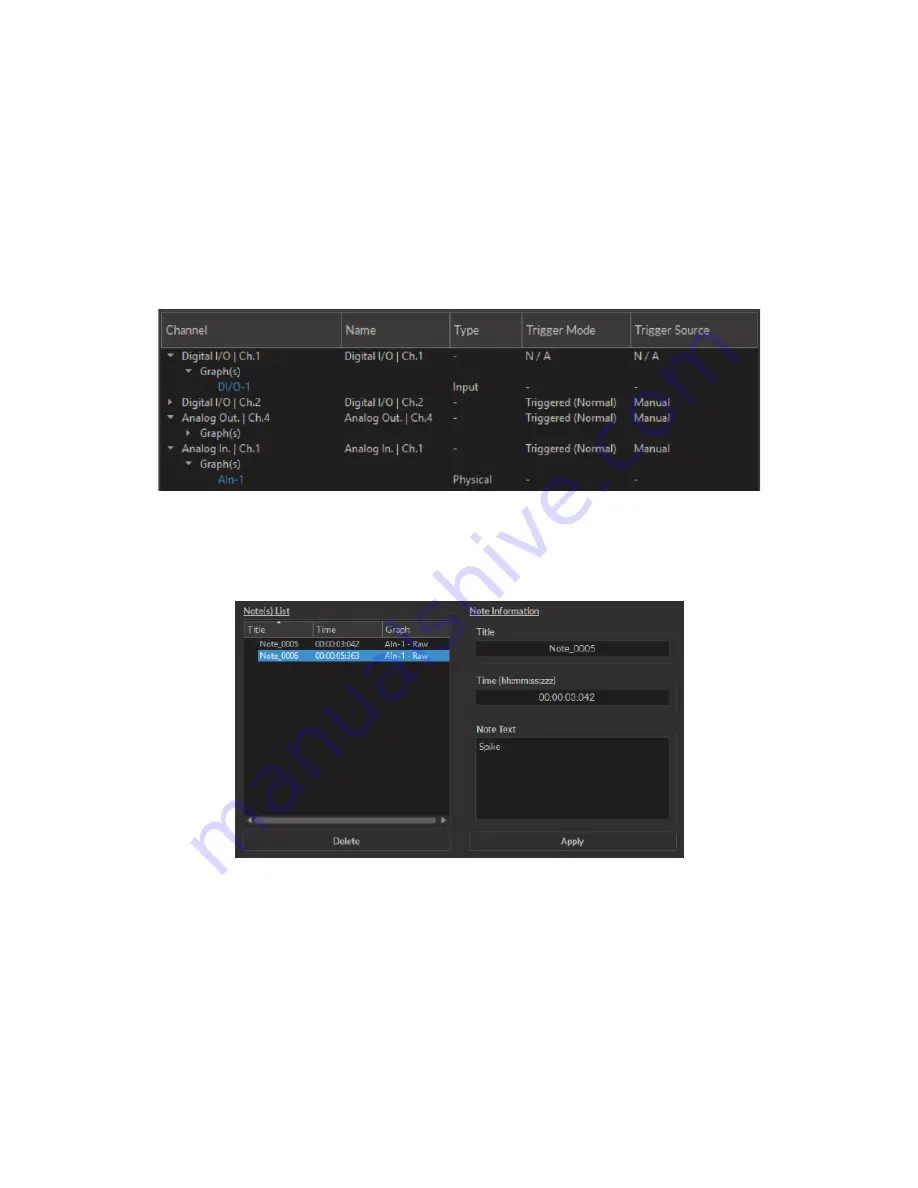
3. The
Show Legend
button (Fig.
) will open the
Legend
window (Fig.
). This window display each configured
Channel
, as well as its
Name
, its
Channel Mode
,
Trigger Mode
and
Trigger Source
if applicable. Selecting the
button while a window is open will close the window.
Figure 3.22:
Legend Window
4. The
Show Notes
button (Fig.
) will open the
Note Viewer
window (Fig.
). Selecting the button while a
window is open will close the window.
Figure 3.23:
Note Viewer Window
• The
Note(s) List
displays the
Title
,
Time
and
Graph
on which a note is marked. Selecting the
Delete
button
will delete any note selected on the list.
• The
Note Information
box displays the information of a note selected in the
Note(s) List
. The
Title
,
Time
and
Note Text
can be edited. The
Apply
button applies these changes to the graph.
3.2.3 Acquisition View
The
Acquisition View
box displays all information concerning active channels. Each channel chosen using
Add Channel
is displayed in this window, occupying a rectangular box.
Each
Channel box
shows the following basic elements, with additional elements available for specific channel types.
Chapter 3. Doric Neuroscience Studio
29


