User’s Manual
14
No.
Name
Description
6
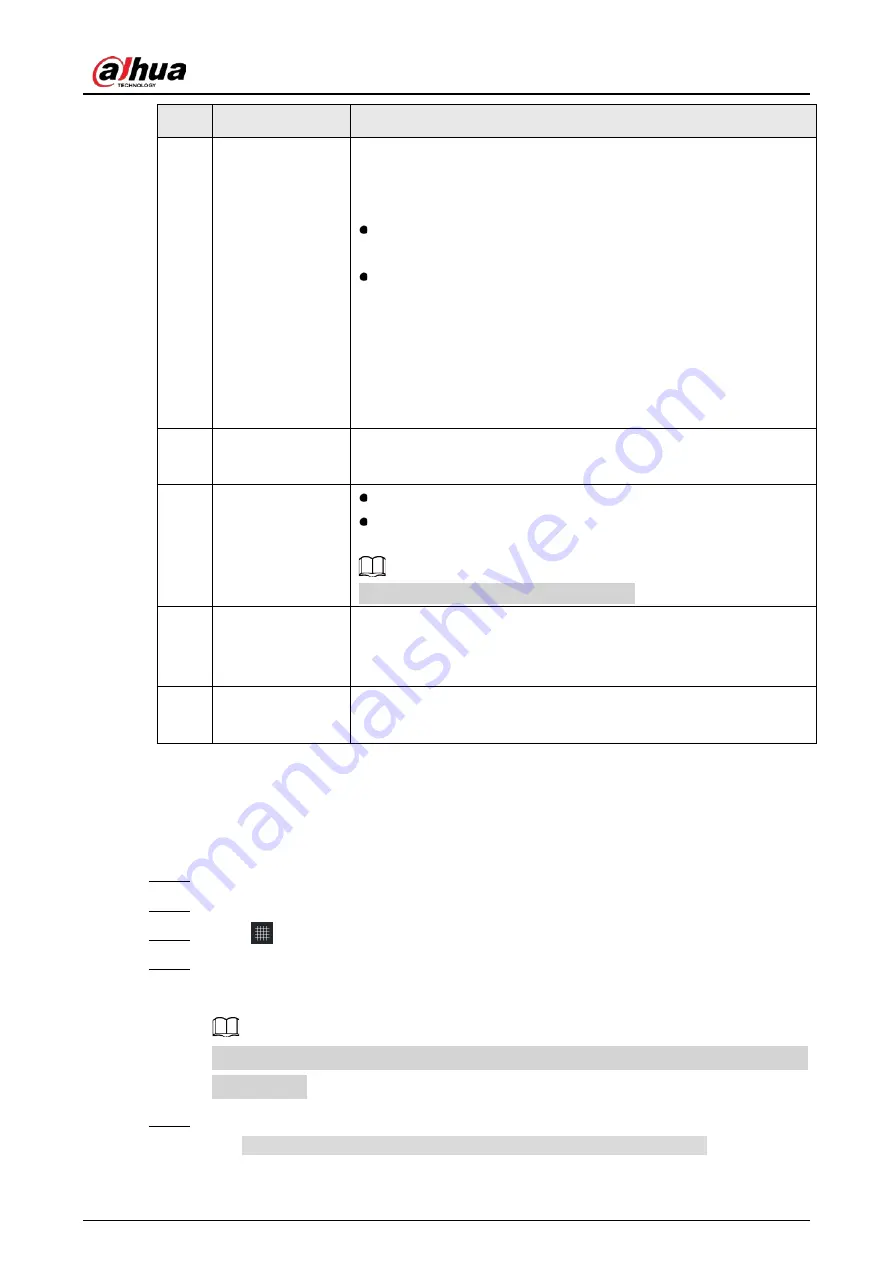
Temperature
Generates a color bar that corresponds to different temperature
values, based on the selected rendering type. The values at either
end define the temperature range in the heat map.
Temperature and color: When the mouse hovers on the heat
map, the temperature of this spot displays.
Enhanced temperature contrast: Enter temperature values at
either end of the bar, and the heat map will automatically change
the color to this temperature range.
Regions with temperatures below the minimum value are
displayed in the leftmost color on the bar.
Regions with temperatures above the maximum value are
displayed in the rightmost color on the bar.
7
Auto
Automatically adjust the color according to the maximum and
minimum temperature of the heat map.
8
Heat map size
Click "-", "+" or drag the slider to adjust the heat map size.
Move the mouse over the heat map and scroll to adjust the heat
map size.
If the size is too big, click and hold to drag.
9
Area temperature
information
On the heat map, select a region (except for points) and its maximum,
minimum and average temperature displays. See "6.2.2 Region and
Temperature" for details.
10
Coordinates
Use the grid function to set a point area. See "6.2.1 Setting a Point
Area" for details.
6.2.1
Setting Point Area
Set the X/Y values of a point area to see its temperature.
Step 1
Open DH Thermal.
Step 2
Click
Thermal Image
and then click the heat map file.
Step 3
Click
.
Step 4
Move and hover the mouse over the heat map, and the X/Y values and temperature will
appear.
You can also see the changing X/Y values, temperature and raw value on the right as the
mouse moves.
Step 5
To set a point area, you can:
Right-click the heat map and then select
set fixed point as point area
.


