DGS-6600 Layer 3 Chassis Ethernet Managed Switch Hardware Installation Guide
68
Areas of the User Interface
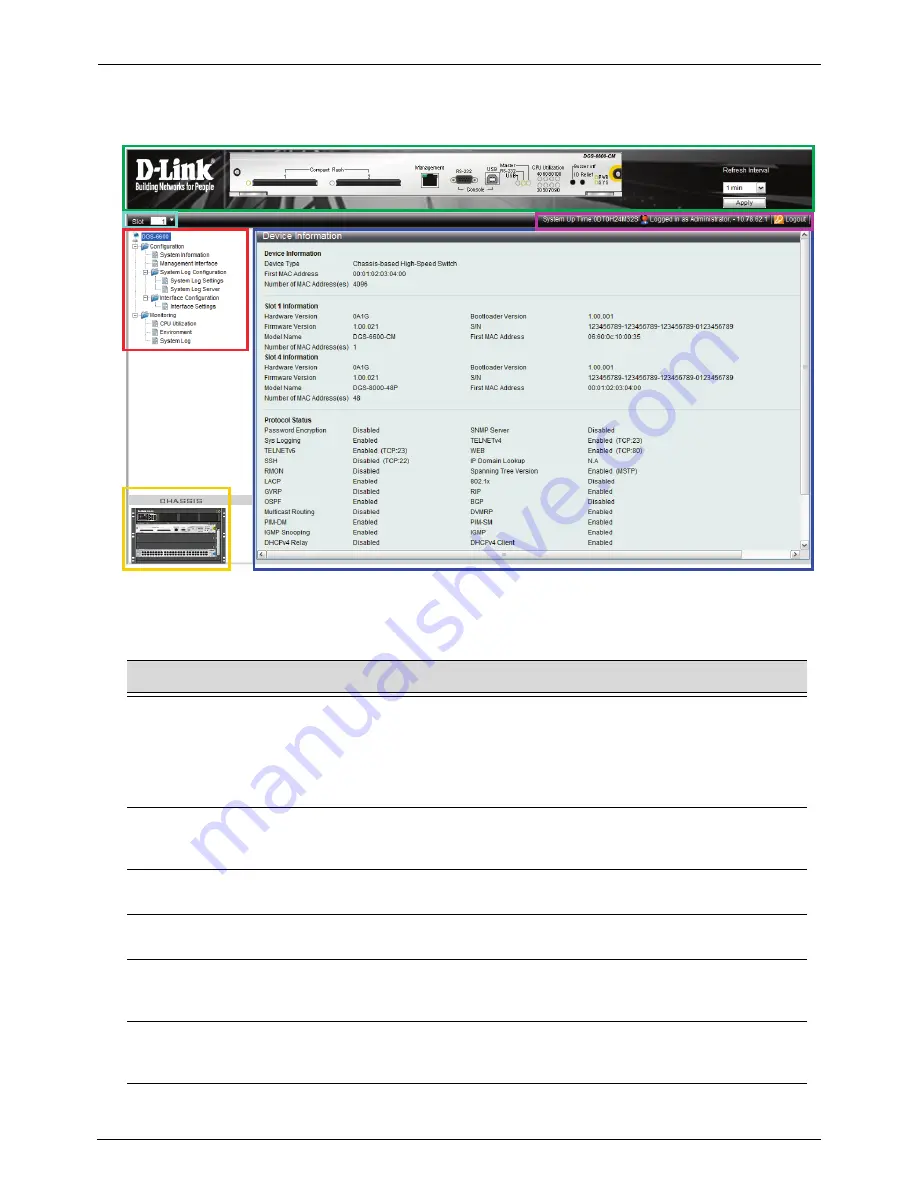
Figure 5-2 shows the user interface. 6 areas divide the user interface and are described in the table 5-1.
Area
Function
Green
Presents a graphical near real-time image of the front panel of the module
selected (slots 1 to 4). This area displays the Module’s LED activity, ports,
buttons and specific module features depending on the slot. Click the D-Link
logo to go to the D-Link Website. Select the Refresh Interval time from the drop
down menu on the right and then click the Apply button to set the interval when
the specific modules LED’s will be updated in the graphical view.
Light Blue
To display the module in a different slot click on the drop-down menu to select
the chassis slot (slots 1-4) desired. The realtime front view of the new module
chosen should appear in the green area.
Red
Select the folder or window to display. Open folders and click the hyperlinked
window buttons and subfolders contained within them to display windows.
Yellow
This area provides a chassis view with the currently installed modules and
power supplies.
Blue
Displays the Switch parameter status based on user selection (in the red area)
and also provides configuration data fields and drop-down menus for
parameters that can be set.
Pink
Displays the system uptime in days, hours, minutes and seconds.
Displays the currently logged in Username and IP address of the user.
Provides a logout button. Click the Logout word to logout of the Web UI.


