Setup Guide
D-Link Corporation
Page - 10 -
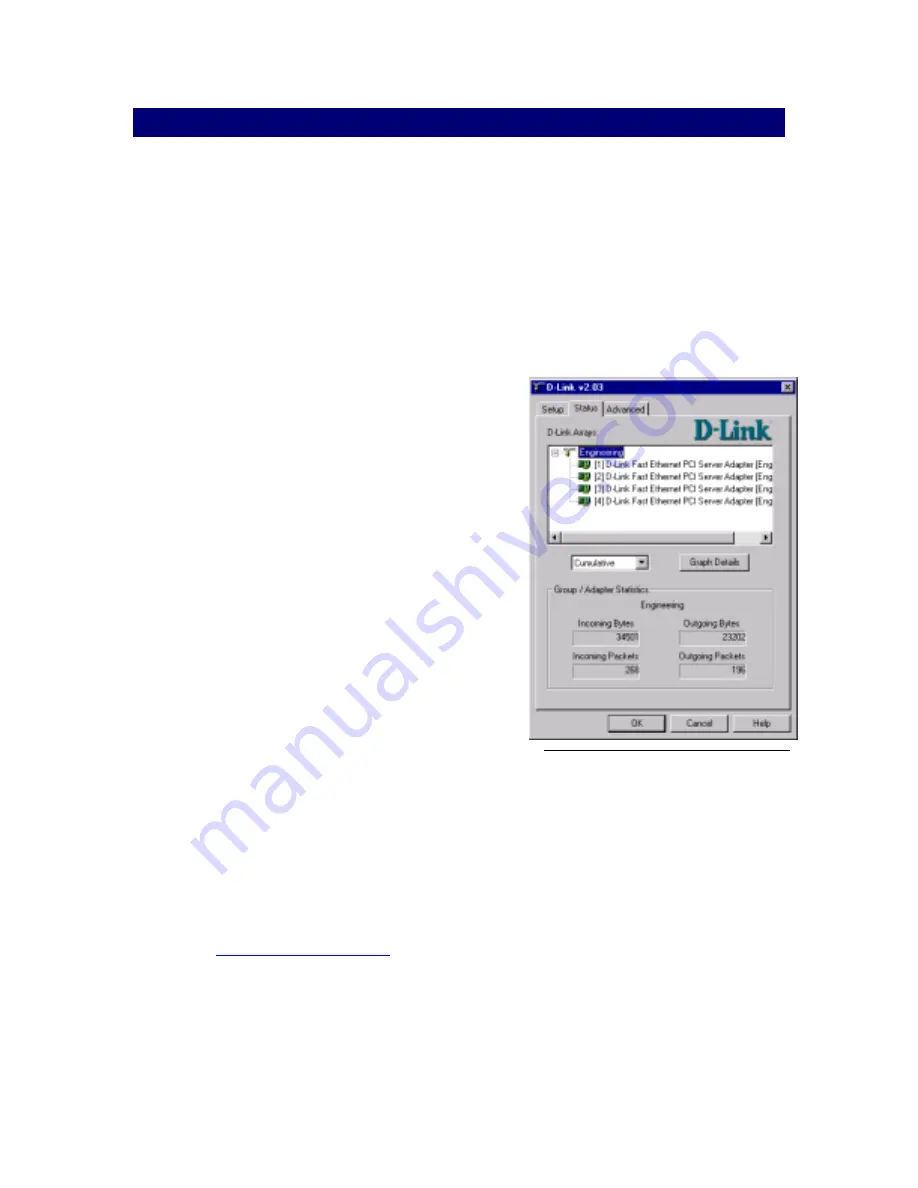
With the Status Dialog, you can quickly
gauge the status of each port.
Using the Load Balancing Utility
Launching the Load Balancing Utility
At any time, you can instantly gauge the status of any port in an array and view
performance statistics on each array or individual ports. To view the status
information, open the Network Control Panel applet and view the properties of the D-
Link Transport by following the steps below.
Step 1
Open the Network Control Panel applet and
select the Protocols tab.
Step 2
Select D-Link Transport and click on the
Properties button. The D-Link load balancing
utility should be displayed with three tabs:
Setup, Status, and Advanced.
Step 3
Select the Status tab to display the current
condition of each port and throughput
statistics for arrays or individual ports.
Throughput statistics can be viewed on a
per-second or cumulative basis. To toggle
between these two modes, use the pull-
down window in the center of the dialog.
Also, throughput can be viewed for individual
ports or for the entire segment or array.
Choose the Segment array name for which
you wish to view statistics in the upper
window or choose the individual NICs within
the array.
Graph Details
In addition to the simple throughput statistics provided in the on the Status tab,
detailed reports and graphs are provided in the Graph utility. To launch the graphing
utility simply, click on the Graph Details button in the center of the Status tab. A
complete overview of the D-Link Graph utility is provided in the section
Using the D-Link Graphing
Utility on page 14.


