3
Examples of experiments
The Flow rate sensor can be used in the following experiments:
•
Calculating Discharge
Stream flow or discharge is the volume of water that moves through a specific
point in a stream during a given period of time. To determine discharge, a
cross-sectional area of the stream or river is measured. Then, the velocity of the
stream is measured using a Flow rate sensor. The discharge can then be
calculated by multiplying the cross-sectional area by the flow velocity.
•
Determining sediment transport rate for a stream or other body of water
The amount of sediment and maximum particle size that can be transported by
moving water is related to the flow velocity. Therefore, flow velocity data
obtained using the Flow rate sensor can be used to determine what size particles
will stay in motion at a particular flow velocity. For a given flow velocity there is
a range of behavioral possibilities for sediment particles lying on the bed, or
entrained within the flow, of a stream. For example, at a measured flow velocity
of 1 m/s, silt and sand (though not compacted clay) will be eroded from the
stream bed and transported downstream. At the same velocity, all sediment
particles between 10 mm and 100 mm that were already in motion will continue
in motion. Particles greater than 100 mm will be deposited. Thus, a Flow rate
sensor can be a valuable observational tool when used in sediment transportation
studies.
•
Measuring and comparing flow rate at various
locations in a stream
Using the Flow rate sensor, it is
possible to map flow characteristics
of a stream by taking measurements
at different spots and depths. To
understand the flow characteristics
within streams of moving water, it is
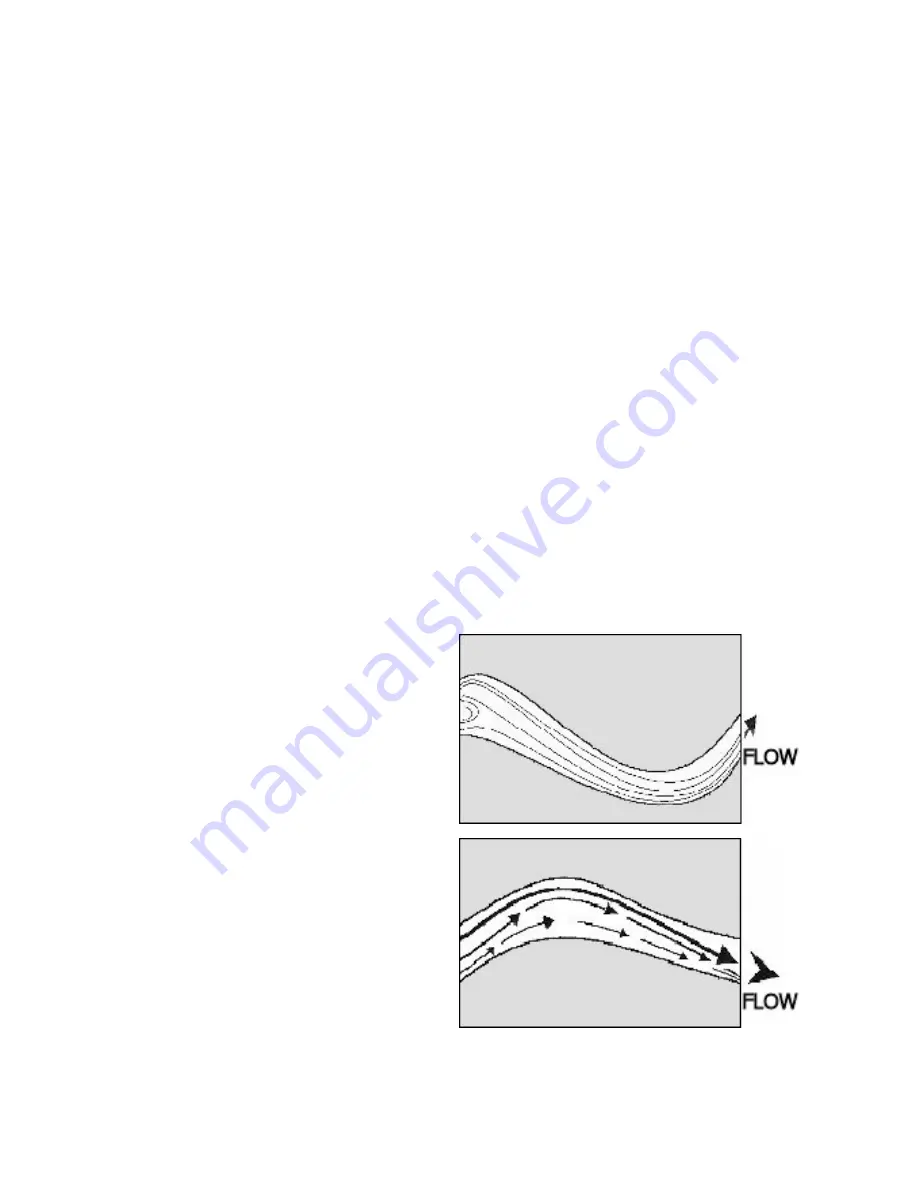
helpful to construct Stream Lines
and Vector Lines.
The first illustration shows how
Stream Lines depict possible paths
of a single fluid particle.
Vector Lines represent both the flow
rate and direction. The longer and
broader the line, the greater the flow
velocity. Vector Lines convey useful
information about the stream flow
characteristics.


