BT17i
Blood Pressure User’s Guide
|
7
I. Determining the cuff (trend) pressure
1.
From the data table determine the number of the measured points. In this
description we assume that the measured data are stored in Run 1.
2.
Right-click the graph and select
Analyze/Process > Select/Remove Data
.
3.
Select under Run the option
Run
1
and select under Selection
method
Point-by-point
.
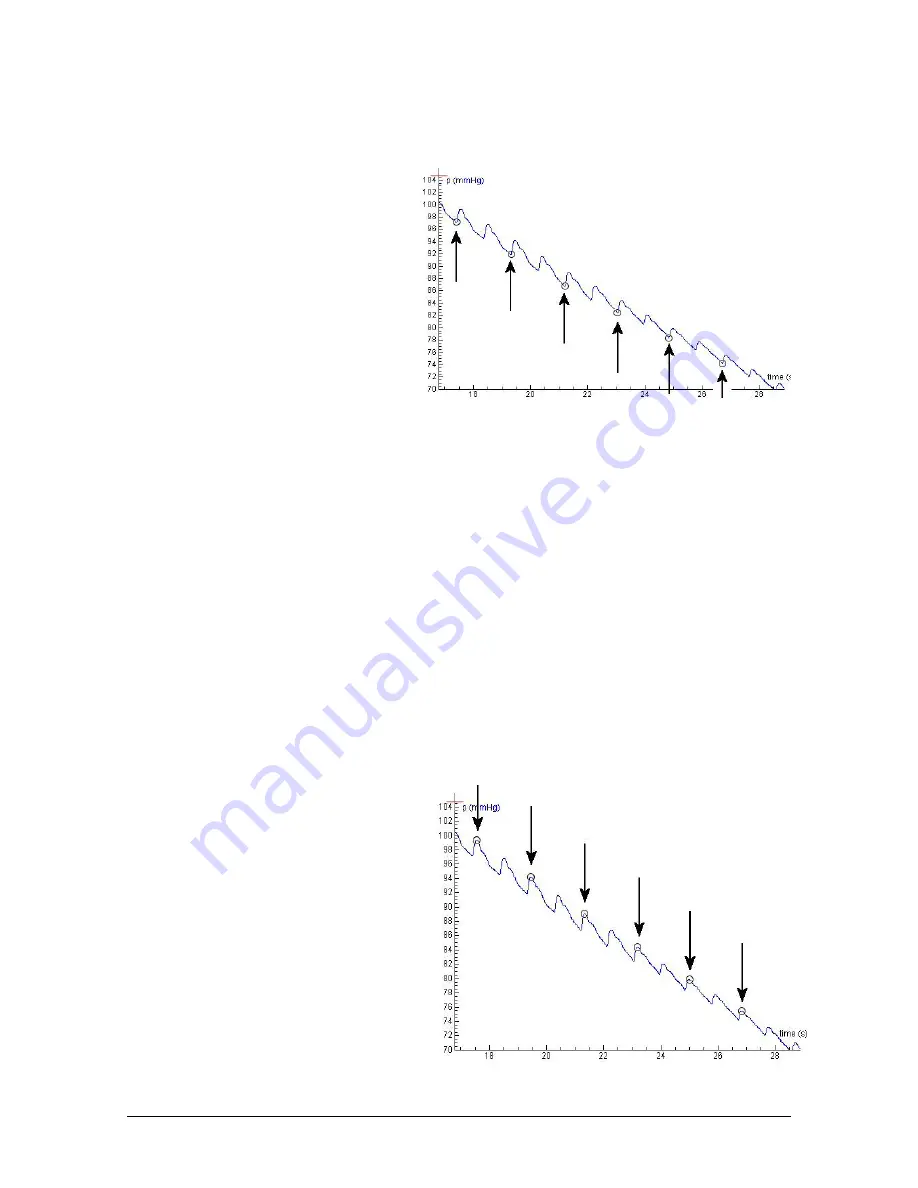
4.
Mark the very first point, very last
point and points where the
pressure values are locally
minimal. These points indicate
the deflating pressure trend of
the cuff (i.e. without the pulses).
You may take every second
minimum.
Tip:
In Coach you can maximize
the Select/Remove Data dialog.
Find the point where the pressure value (displayed in the pressure coordinate field)
is locally minimal.
5.
Mark
Keep selected
and click
OK
. As the result you get Run 2 with only the selected
data points. These points determine the graph of the trend pressure.
6.
To extend the number of points in the graph you can smooth the graph.
•
Right-click the graph and select
Analyze/Process > Smooth
.
•
Select under Run the option
Run 2
(with the selected lower points).
•
Select the method
Spline
.
•
Click
Plot
to draw the smooth graph.
•
Click
OK
to accept
.
•
Type the number of points of the original pressure graph (determined in step 1)
in the
Number of Points
field and confirm.
•
As a result you get a new Run 3 with many more points. These are the trend
pressure data. You can rename this run into
p_trend
.
II. Determining the pulse pressure
7.
Repeat the steps 2 to 5. Mark the
very first point, very last point and
this time mark the maximal
pressure values, the tops of the
pulses. Take the upper points just
after the lower points, so you will
get exactly the same number of
selected data (see figure 3 and 4).
8.
As the result you get Run 4 with the
selected upper data points. These
are the pressure pulses.
9.
Repeat step 6 to smooth the data.
As the result you get Run 5 with
Figure 4
.
Select the points at which the pressure
value is maximal, just when pressure signal rises.
Figure 3
. Select the points at which the pressure value
is minimal, just before the pressure signal rises again.


