CTD-N Technical Manual
page 60
EAR-Controlled Technology Subject to Restrictions Contained on the Cover Page.
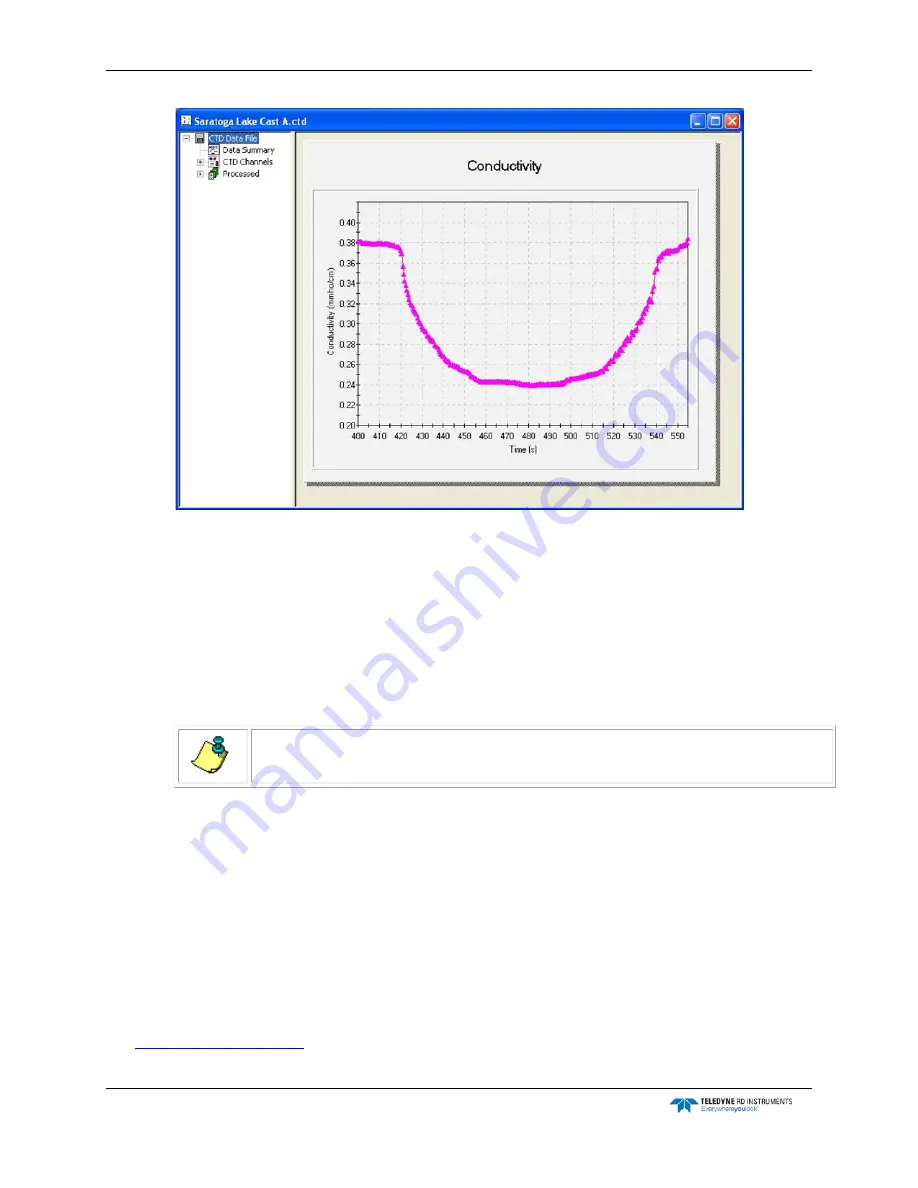
Figure 30.
The Graphics Display Opened to the Conductivity Graph
4. To display a list of available CTD Channels data parameters, click the plus sign (+) to the
left of CTD Channels.
To display a list of available Processed data parameters, click the plus sign (+) next to Pro-
cessed.
5. To display a graph of any parameter in the CTD Channels data parameters list or the Pro-
cessed data parameters list, click the parameter in the list.
NOTE.
The Conductivity graph is always displayed initially by default.
The selected graph is displayed in the graphics display as shown Figure 32 for the tempera-
ture data and in Figure 33 for the pressure data.
Zooming in and Out of a Graph
To zoom in on a graph, press and hold the Shift key and click and hold the left mouse button while
drawing a box around the area you want to zoom in on, and then release the mouse button.
To zoom out to the full view of the graph, type "R."
Setting up a Graph
The graph in the graphics display can be set up, allowing you to select the scaling, the labeling, the
colors, the style, and a number of other settings. To set up a graph, view the graph as described in
, and then right click anywhere in the graph. The 2D Chart Control Proper-
ties dialog box shown in Figure 31 opens. All the graph settings are made in the 2D Chart Control


