

36
6
(
g
)
1
(
y
σ
n
-1
) .......
y
data sample standard
deviation
2
(minY) ......
y
data minimum value
3
(maxY) .....
y
data maximum value
6
(
g
) ........... Previous menu
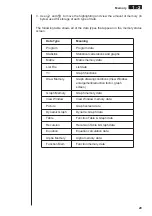
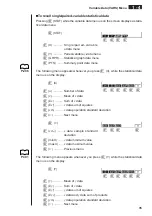
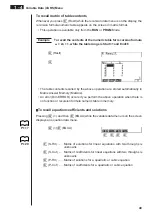
The following menu appears whenever you press
3
(GRPH) while the statistical
data menu is on the display.
3
(GRPH)
1
(
a
)-
5
(
e
) .. Statistical graph regression
coefficient and multinomial
coefficients
6
(
g
) ........... Next menu
6
(
g
)
1
(
r
) ............. Statistical graph correlation
coefficient
2
(Q1) .......... First quartile
3
(Med) ....... Median of input data
4
(Q3) .......... Third quartile
5
(Mod) ....... Mode of input data
6
(
g
) ........... Previous menu
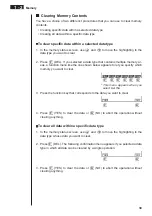
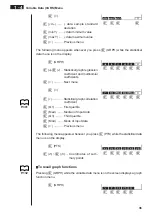
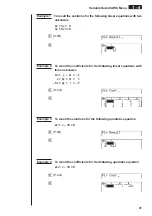
The following menu appears whenever you press
4
(PTS) while the statistical data
menu is on the display.
4
(PTS)
1
(
x
1) ~
6
(
y
3) .... Coordinates of sum-
mary points
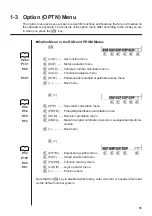
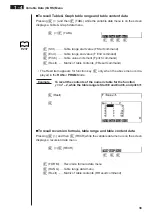
uuuuu
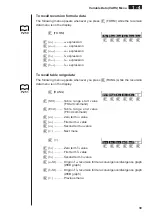
To recall graph functions
Pressing
4
(GRPH) while the variable data menu is on the screen displays a graph
function menu.
4
(GRPH)
1 2 3
4 5
6
1 2 3 4 5 6
1 2 3 4 5 6
1 2 3 4 5 6
1 2 3 4 5
6
P.301
1 - 4
Variable Data (VARS) Menu
P.132