


19990401
○ ○ ○ ○ ○
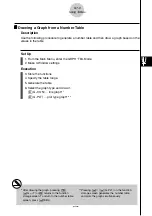
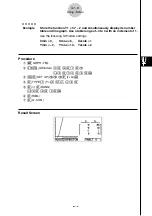
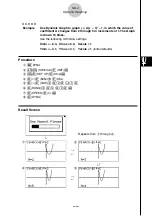
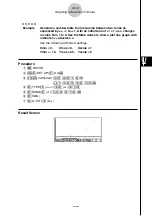
Example
Store the function Y1 = 3
x
2
– 2 and simultaneously display its number
table and line graph. Use a table range of –3 to 3 with an increment of 1.
Use the following V-Window settings.
Xmin = 0,
Xmax = 6,
Xscale = 1
Ymin = –2,
Ymax = 10,
Yscale = 2
Procedure
1
m
GRPH
•
TBL
2
!
K
(V-Window)
a
w
g
w
b
w
c
-
c
w
ba
w
c
w
i
3
u
3
(SET UP)
ccc
1
(T+G)
i
4
3
(TYPE)
b
(Y=)
d
vx
-c
w
5
6
(
g
)
2
(RANG)
-
d
w
d
w
b
w
i
6
5
(TABL)
7
4
(G
•
CON)
Result Screen
5-7-14
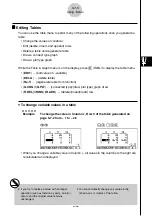
Using Tables
20011101


