


Decimator Quick Tour
SED Systems, a division of Calian Ltd.
(Proprietary)
10
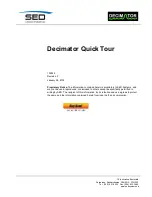
Figure 12 New Measurement
●
You will notice a Carrier Monitoring Toolbar added to the left of the display. More on
this later.
●
We could connect another RF feed to other switch port(s) on the Decimator and bring
in other carriers from different feeds, but for this example, all 4 carriers will be on
Switch Port 1. If you need to change the switch port, click the SYSTEM button and set
the Switch Port to 2.
●
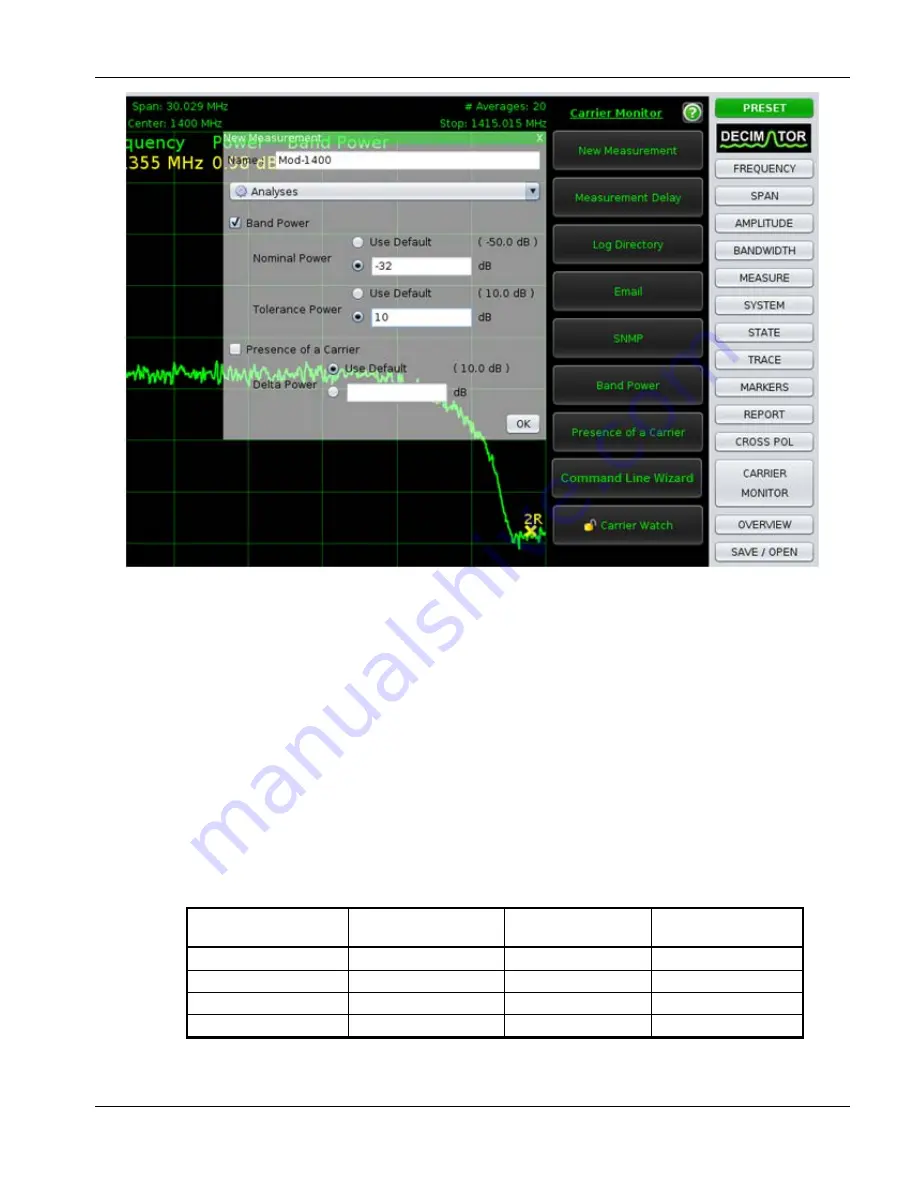
We will go ahead and repeat the above bulleted steps for the other 3 carriers with the
adjustments in settings specified in Table 1 to create a total of 4 measurements.
Configure these settings using the FREQUENCY and SPAN buttons as before or lock
them in using the Overview Bar. Your choice.
Table 1 Measurement Settings
Measurement Name
Center Frequency
(MHz)
Span
(MHz)
Nominal Power
(dBm)
Mod-1400
1400
30
-32
Mod-1300
1300
50
-22
Mod-1500
1500
50
-46
CW-1600
1600
1
-16


