


Decimator Quick Tour
SED Systems, a division of Calian Ltd.
(Proprietary)
19
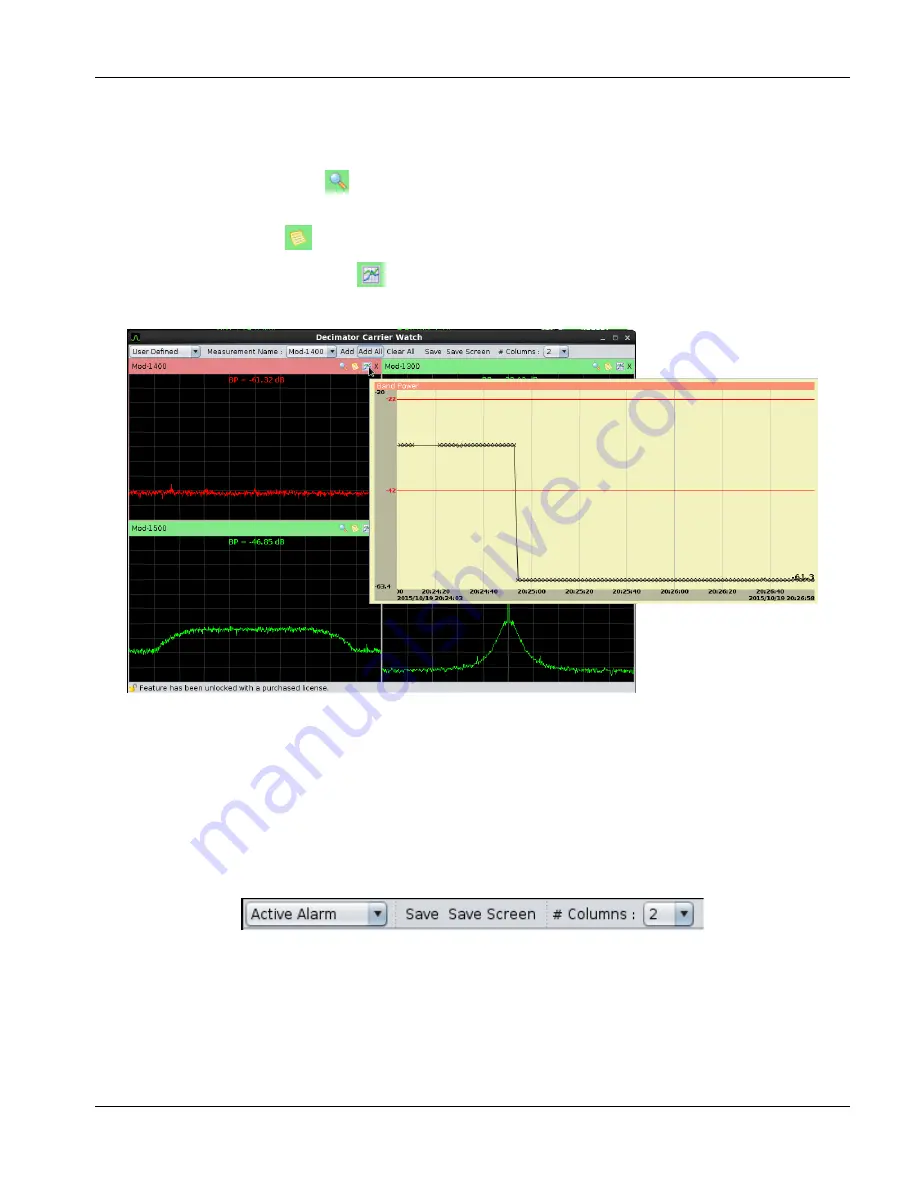
You will see the trace for each measurement update and the state evaluated. Each Measurement Tile
has the following information:
●
Measurement name and its state depicted in colour
●
A Zoom button.
Clicking this button displays the CarrierWatch Zoom Window.
More on this in a bit.
●
A Settings
tooltip to show the settings such as Center Frequency, Span, etc.
●
An Analysis History
tooltip to show you the band power and other analysis results
as a function of time
Figure 22 CarrierWatch Dashboard – Analysis History
●
An “X” button to remove the measurement from the CarrierWatch Dashboard
The CarrierWatch Dashboard has 3 modes: User Defined, Active Alarm and Historical Alarm. You
have seen the User Defined mode above. The Active Alarm mode only shows the Measurements
presently in alarm condition with the most recently raised alarm in the top left of the screen as shown
in Figure 23.
Figure 23 CarrierWatch Dashboard – Active Alarm Mode Toolbar


