39
Right clicking in the graph area (selected commands)
Clear graph
will just clear the curves in the graph view, but all data that has been recorded
will be kept. The graph can be reloaded by pressing the “Load Data” button in the “Load
Data” window. It may take a little longer for the data to show up in the Graph window, than it
does in the “Load Data” window.
AutoScale X
Automatically scales the x-axis to contain all data.
AutoScale Y
Automatically scales the y-axis to contain all data.
Export
A picture of the current view of the graph can be exported as a picture, excel file, or added to
the clipboard. (To export the experiment data, see the Load Data page guide.)
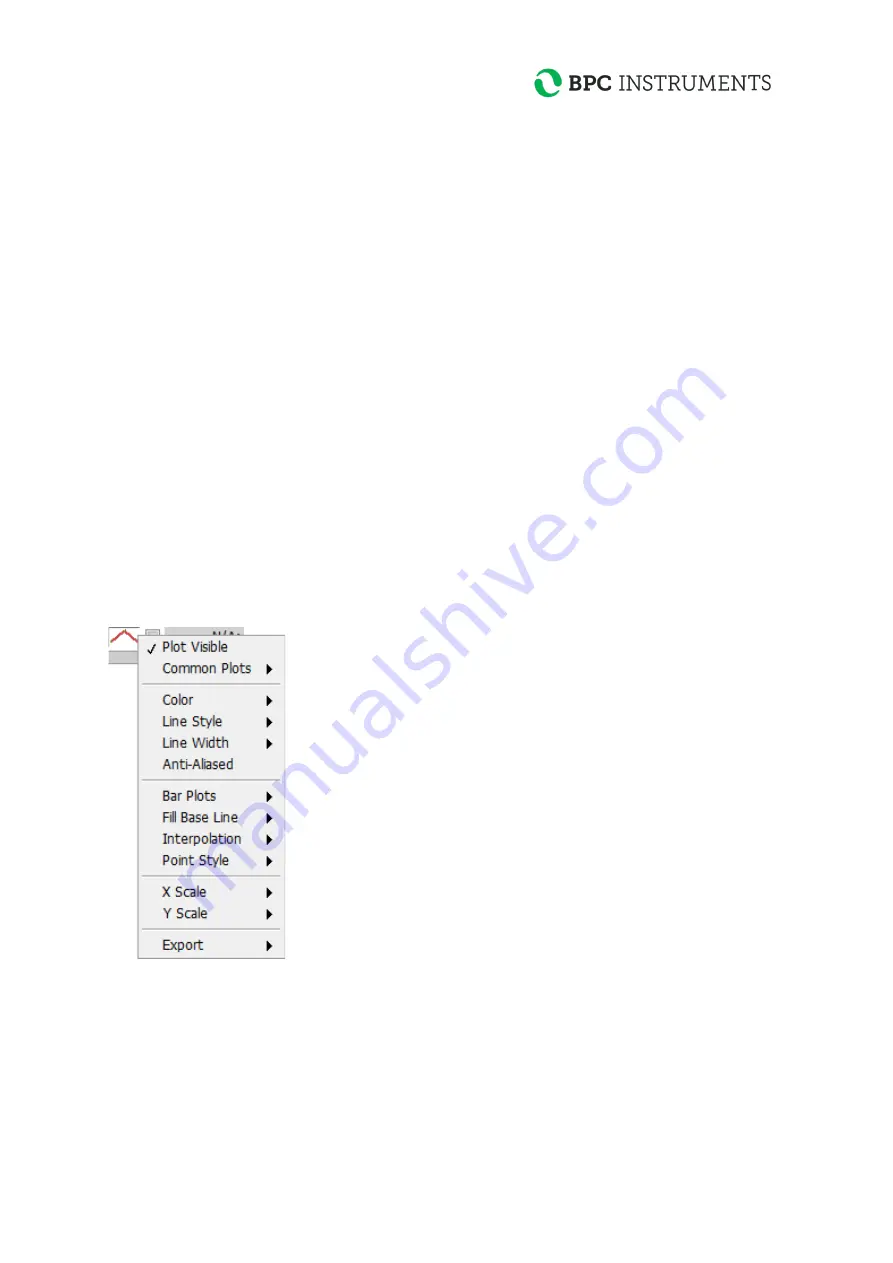
Clicking on the icon associated with a specific graph (selected commands)
Left or right clicking the icon associated with a specific graph can reach additional software
features. Selected functions will be described below.
Plot Visible
This option toggles the visibility of the selected plot and is equivalent to the user clicking on
the checkbox located to the left of the specific line’s name.
Содержание uFlow
Страница 1: ...µFlow Gas flow meter Operation and Maintenance Manual ...
Страница 2: ......
Страница 3: ...µFlow ...
Страница 26: ...21 2 Open the Volume folder 3 Select the setup exe file and open it ...
Страница 28: ...23 5 Click next ...
Страница 29: ...24 6 When the installation summary shows up start the installation by clicking Next ...
Страница 30: ...25 7 A window will show the installation progress ...
Страница 32: ...27 11 Open the Volume folder 12 Select the setup exe file and open it ...
Страница 33: ...28 13 The installation is started and a green status bar shows the progress ...
Страница 34: ...29 14 Select a destination directory for the files ...
Страница 35: ...30 15 Start the installation by clicking Next ...
Страница 36: ...31 16 The green status bars show the progress ...


