


Fault Location Mode
77
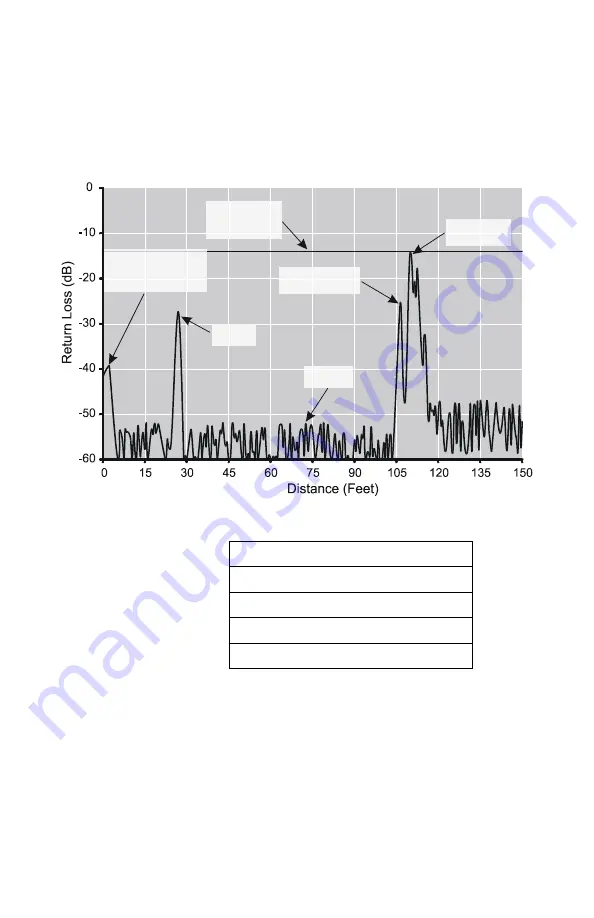
Interpreting the Fault Location Measurement
The graph below shows a typical Fault Location mea-
surement for an antenna system. The table lists typi-
cal component return losses.
1. Each connector or jumper will show up as a spike.
If it is larger than the typical value, check the
connector for damage.
2. Spikes where there are no components represent
faults. Note the distance and check the line at that
point for damage.
3. The largest spike is usually due to the antenna.
Typically the trace after the antenna can be
ignored.
Antenna
Connector
Fault
Connection to
Site Analyzer
Limit Line
at –14 dB
Noise
Typical Component Return Loss
Antenna
–14 dB
Connectors
–25 dB
Jumpers
–35 dB
Lightning Protector
–25 dB
Transmission Lines
–30 dB
Содержание SITE ANALYZER SA-1700EX
Страница 2: ...This page is not blank...
Страница 8: ...Bird Site Analyzer vi...
Страница 9: ...vii...
Страница 30: ...Bird Site Analyzer 16...
Страница 142: ...Bird Site Analyzer 128...
Страница 148: ...Bird Site Analyzer 134...
Страница 159: ...Maintenance 145 Measured Return Loss dB...
Страница 161: ...Maintenance 147 SA 6000 Measurement Uncertainty Return Loss after one refresh Measured Return Loss dB Directivity...
Страница 167: ...Maintenance 153 the number of data points you wish measure 238 475 949...


