UMAX030440 Version 2B 13-51
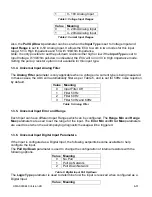
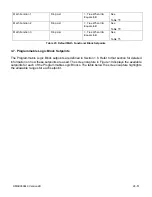
Table 13: Table X
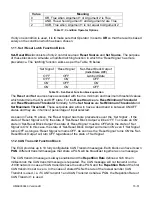
– Conditions Logical Operator Options
The three logical operations are evaluated in order and the first to satisfy gets selected, thus if
Table1 logical operation is satisfied, the Lookup Table associated with Table1 gets selected
regardless of two other logical operations. In addition, if none of the logical operations is satisfied
the Lookup Table associated with Table1 gets selected.
1.9. Lookup Table Function Block
Lookup Tables are used to give output response up to 10 slopes per input. If more than 10 slopes
are required, A Programmable Logic Block can be used to combine up to three tables to get 30
slopes as described in Section 1.8.
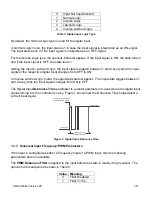
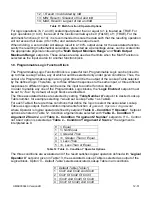
Lookup tables have two differing modes defined by “
X-Axis Type
” setpoint, given in Table 14.
Option ‘0 – Data Response’ is the normal mode where block input signal is selected with the “
X-
Axis Source
” and “
X-Axis Number
” setpoints and X values present directly input signal values.
With option ‘1 – Time Response’ the input signal is time and X values present time in milliseconds.
And selected input signal is used as digital enable.
0
Data Response
1
Time Response
Table 14: X-Axis Type Options
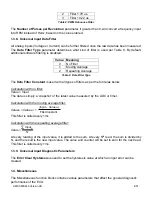
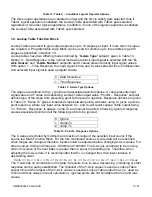
The slopes are defined with (x, y) points and associated point response. X value presents input
signal value and Y value corresponding Lookup Table output value. “PointN – Response” setpoint
defines type of the slope from preceding point to the point in question. Response options are given
in Table 15
. ‘Ramp To’ gives a linearized slope between points, whereas ‘Jump to’ gives a point to
point response, where any input value between X
N-1
and X
N
will result Lookup Table output being
Y
N
. “Point0 – Response” is always ‘Jump To’ and cannot be edited. Choosing ‘Ignored’ response
causes associated point and all the following points to be ignored.
0
Ignore
1
Ramp To
2
Jump To
Table 15: PointN
– Response Options
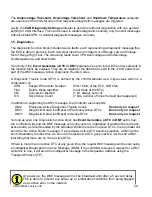
The X values are limited by minimum and maximum range of the selected input source if the
source is a Math Function Block. For the fore mentioned sources X-Axis data will be redefined
when ranges are changed, therefore inputs should be adjusted before changing X-Axis values. For
other sources Xmin and Xmax are -100000 and 1000000. The X-Axis is constraint to be in rising
order, thus value of the next index is greater than or equal to preceding one. Therefore, when
adjusting the X-Axis data, it is recommended that X
10
is changed first, then lower indexes in
descending order.
𝑋𝑚𝑖𝑛 <= 𝑋
0
<= 𝑋
1
<= 𝑋
2
<= 𝑋
3
<= 𝑋
4
<= 𝑋
5
<= 𝑋
6
<= 𝑋
7
<= 𝑋
8
<= 𝑋
9
<= 𝑋
10
<= 𝑋𝑚𝑎𝑥
The Y-Axis has no constraints on the data it presents, thus inverse, decreasing, increasing or other
response can be easily established. The Smallest of the Y-Axis values is used as Lookup Table
output min and the largest of the Y-Axis values is used as Lookup Table output max (i.e. used as
Xmin and Xmax values in linear calculation.). Ignored points are not considered for min and max
values.


