background image

The Timeline View 

ARM DUI 0482K

Copyright © 2010-2012 ARM. All rights reserved.

6-13

ID120712

Non-Confidential

6.3

Customizing charts

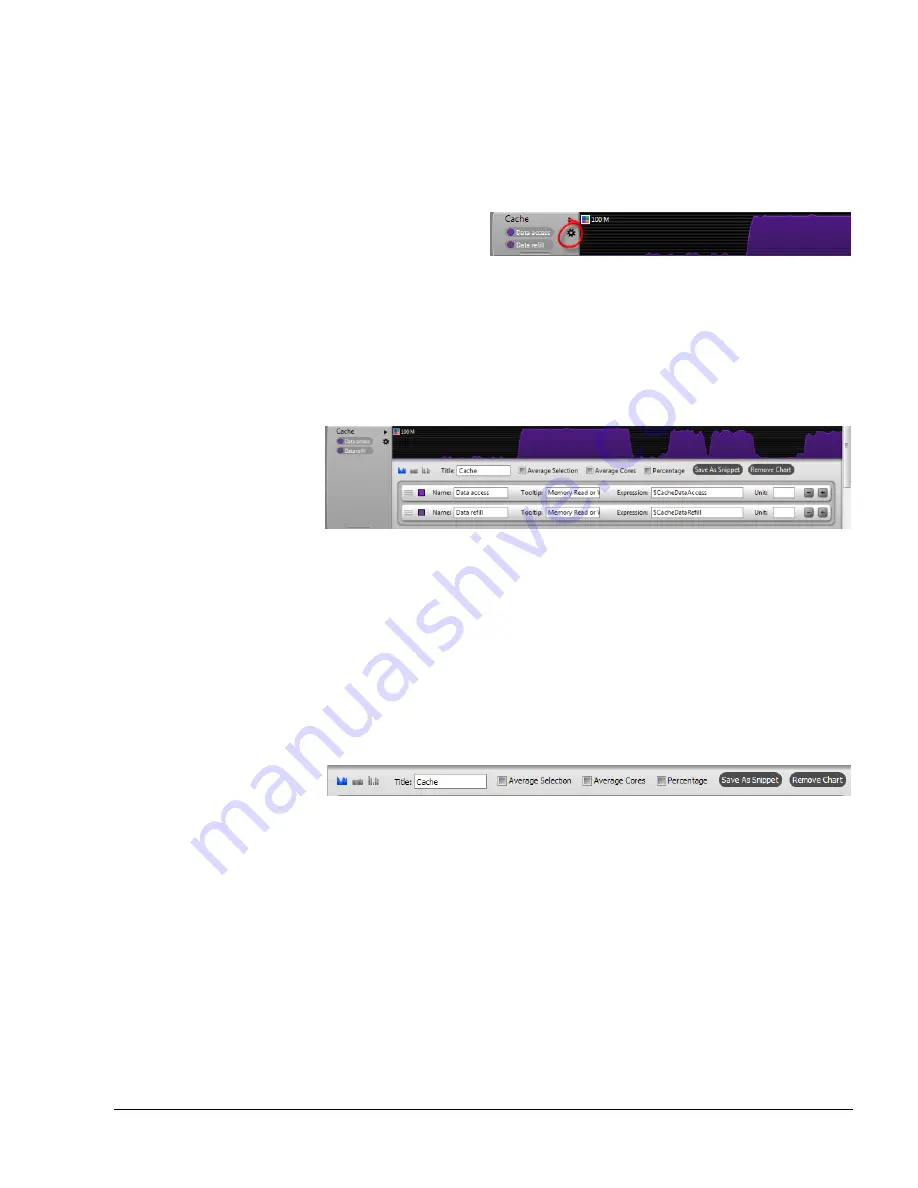
Many of the charts in the Timeline view have a button, located near the top right of the chart 
handle, that opens a Chart Configuration panel. You can use this panel to change all aspects of 
the chart from color to the data sets that the chart uses, giving you the option to display the data 
you want in the manner you want it presented.

Figure 6-17 The Chart Configuration button

The Chart Configuration panel is broken down into two sections:

A toolbar section that contains controls that apply to the chart as a whole

A series section, which contains one or more series controls.

For example, the Cache chart contains two series, 

Data access

 and 

Data refill

.

Figure 6-18 The Chart Configuration panel and Cache chart

The 

Data access

 series uses data from the 

$CacheDataAccess

 counter, while 

Data refill

 uses 

$CacheDataRefill

.

In the toolbar, the Cache chart is defined as a 

Stacked

 chart, so the Timeline view draws it as 

two stacked line graphs.

6.3.1

Chart Configuration toolbar options

Use the toolbar of the Chart Configuration panel to define chart options that apply to all series 
in a chart.

Figure 6-19 The Chart Configuration panel toolbar

The toolbar of the Chart Configuration panel has the following options:

Type 

Use the Type buttons on the left side of the toolbar to choose between one of the 
following chart types:

Stacked 

In a stacked style chart, filled line charts are stacked on top of each 
other. The Timeline view stacks a filled line graph representing the 
series at the top of the chart control on top of series that appear beneath 
it. So the highest point of the graphs in a stack chart is an aggregate of 
data from all of the series contained in the chart control. For example, 
if the first value of series A is three and first value of series B is five, 
the first data point in the stack chart that contains these series is eight.

Содержание DSTREAM DS-5

Страница 1: ...Copyright 2010 2012 ARM All rights reserved ARM DUI 0482K ID120712 ARM DS 5 Version 5 13 Using ARM Streamline ...

Страница 2: ... not be liable for any loss or damage arising from the use of any information in this document or any error or omission in such information or any incorrect use of the product Where the term ARM is used it means ARM or any of its subsidiaries as appropriate The Visual Annotation screenshots in the documentation feature the DOOM software from the PrBoom project and contributors http www crowproduct...

Страница 3: ...w 3 1 The Streamline Data view 3 2 Chapter 4 Setting Capture Options 4 1 Opening the Capture Options dialog box 4 2 4 2 Capture options 4 3 Chapter 5 Configuring Counters 5 1 Opening the Counter Configuration dialog box 5 2 5 2 Using the Counters Configuration dialog box 5 4 Chapter 6 The Timeline View 6 1 About the Timeline view 6 2 6 2 Timeline view charts 6 10 6 3 Customizing charts 6 13 6 4 Fi...

Страница 4: ...he Log View 10 1 Customize reports using Annotate 10 2 10 2 Adding bookmarks using Annotate 10 5 10 3 Adding images to reports using Visual Annotate 10 7 10 4 The Log view 10 9 Chapter 11 Advanced Customizations 11 1 Capturing data on your target 11 2 11 2 Creating custom performance counters 11 4 11 3 Using Stored Streamline Capture Data to create new Streamline Analysis Reports 11 9 11 4 Profili...

Страница 5: ...underlined text can be entered instead of the full command or option name monospace italic Denotes arguments to commands and functions where the argument is to be replaced by a specific value monospace bold Denotes language keywords when used outside example code italic Highlights important notes introduces special terminology denotes internal cross references and citations bold Highlights interfa...

Страница 6: ... then send an e mail to errata arm com Give the title the number ARM DUI 0482K if viewing online the topic names to which your comments apply if viewing a PDF version of a document the page numbers to which your comments apply a concise explanation of your comments ARM also welcomes general suggestions for additions and improvements ARM periodically provides updates and corrections to its document...

Страница 7: ... into reports that present the data in both visual and statistical forms Streamline uses hardware performance counters with kernel metrics to provide an accurate representation of system resources Streamline supports Cortex A5 Cortex A7 Cortex A8 Cortex A9 Cortex A15 ARM9 ARM11 and Qualcomm Snapdragon Scorpion and Krait processors running ARM Linux or Android The following topics describe how to s...

Страница 8: ...M does not provide the cycle and timing information to make the samples generated data in the reports meaningful 2 1 2 Load the gator daemon The gator daemon and driver collect target metrics and then send them to your host machine To enable profiling you must build and load the gator daemon on your target Follow these steps to build the gator daemon from the source archive 1 Move to the directory...

Страница 9: ... the following in your shell make menuconfig You must enable certain kernel configuration options to run Streamline The location of some of these options depends on your kernel version General Setup Enable the Profiling Support option CONFIG_PROFILING and the Kernel performance event and counters option CONFIG_PERF_EVENTS Kernel Hacking Enable the Tracers option CONFIG_FTRACE and the Tracers Trace...

Страница 10: ...ep CONFIG_PROFILING 2 1 4 Build the gator module To use Streamline with your ARM target you may build the gator driver on a Linux host or build it locally on your target DS 5 provides a gator driver tar gz source archive Assuming that you have unzipped the file and that you have all of the required tools for building kernel modules enter the following command on your target to create the gator ko ...

Страница 11: ...cation of the session xml file Include the directory location and the file name This option is most useful when performing a local capture For more information see Capturing data on your target on page 11 2 o Useful when performing a local capture use this option to define the location of the apc directory v Displays the version information for gatord Note To unload the gator daemon determine the ...

Страница 12: ...G_KERNEL_INFO Kernel Features Enable the High Resolution Timer Support option CONFIG_HIGH_RES_TIMERS and the Enable hardware performance counter support option CONFIG_HW_PERF_EVENTS Enable the Use local timer interrupts option CONFIG_LOCAL_TIMERS if you are using a Symmetric MultiProcessing SMP target CPU Power Management To enable the CPU Freq Timeline view chart gator requires kernel version 2 6...

Страница 13: ... to build gatord ndk build Note If ndk is not on your path instead issue the following command execute path to ndk ndk build 5 The newly created gatord is located in build_directory libs armeabi Note You must build the gator daemon on your gcc enabled target or a Linux host It is not possible to build the gator daemon on a Windows host 2 2 3 Build the gator module To use Streamline with your Andro...

Страница 14: ...t the gator daemon To run gatord 1 Copy gatord and gator ko into the file system on the target For example adb push gatord_location target_location 2 To ensure gatord has execute permission enter the following command on the target or from your host using adb shell chmod x gatord 3 If gatord is in a different directory than gator ko on the target you must either Insert the gator ko module manually...

Страница 15: ...rocess_id By default gatord uses port 8080 for communication with the host but you can adjust this by launching gatord with the port number as a parameter and changing the Port option in the Capture Options dialog box For example gatord 5050 To open the Capture Options dialog box click Change capture options in the Streamline Data view 2 2 6 Set capture options to support your Android target In th...

Страница 16: ... information see Capture options on page 4 3 fno inline Disables inlining This compiler setting substantially improves the call path quality fno omit frame pointer Compiles your EABI images and libraries with frame pointers This enables Streamline to record the call stack with each sample taken marm This option is required if you compile your code with the with mode thumb option enabled Using the ...

Страница 17: ... h header file containing the declaration of the Linux tracepoints necessary for Mali support To build the gator module for Mali follow these steps 1 Add the following options to your gator ko make command KCFLAGS IMali_driver_source_location src devicedrv mali GATOR_WITH_MALI_SUPPORT MALI_Device_Number Replace Device_Number in the command with either 400 or T6xx depending on your Mali device type...

Страница 18: ... DUI 0482K Copyright 2010 2012 ARM All rights reserved 2 12 ID120712 Non Confidential Capture options on page 4 3 The Streamline Data view on page 3 2 Charts specific to Mali targets on page 6 11 Mali specific events on page 5 5 ...

Страница 19: ... Streamline Data View The Streamline Data view enables you to set target connection settings start and stop capture sessions and create new Streamline Analysis Reports from stored capture sessions The following topic describes how to open and use the Streamline Data view The Streamline Data view on page 3 2 ...

Страница 20: ...w Delete Deletes a stored Capture Data or Streamline Analysis report from the file system Refresh Refreshes the contents of the of the Streamline Data view If you have added Streamline files to any of your defined locations outside of Eclipse use Refresh to sync this view Address Enter the IP address of your target here This can also be defined in the Capture Options dialog box Edit Locations Open...

Страница 21: ... Options dialog box Streamline connects to the target at the address that you entered in the Address field using default values for each of the capture options Once pressed a dialog box appears that prompts you to enter a title for the Capture Figure 3 3 Naming your Capture Streamline adds the parent directory of the capture to the Analysis Data Locations list if it is not already there When the c...

Страница 22: ...any Capture Data and Streamline Analysis Reports contained in any of paths listed in this dialog box To edit an existing path double click on it The following buttons are included in the Analysis Locations dialog box Add Opens another dialog box that enables you to search your file system to add a new folder to the list Note There is a sample Streamline Analysis Report in the xaos sample directory...

Страница 23: ...of Streamline Capture Data If an upgrade to Streamline renders a Streamline Analysis Report incompatible double click on the Streamline Capture Data resource to re analyze it and create a new compatible Streamline Analysis Report It is recommended that you re create Streamline Capture Data if it you created it using a version of gator many generations old 3 1 4 Stopping a capture session manually ...

Страница 24: ... 1 ID120712 Non Confidential Chapter 4 Setting Capture Options The following topics describe how to open the Capture Options dialog box and describe each of the settings it contains Opening the Capture Options dialog box on page 4 2 Capture options on page 4 3 ...

Страница 25: ...ffer size To open the Capture Options dialog box 1 Make sure that you have the Streamline Data view open Figure 4 1 The Streamline data view To open the Streamline Data view select Window Show View Other and choose it from the ARM Streamline folder 2 Click Change capture options located in the upper right of the Streamline Data view Figure 4 2 The Change capture options button 4 1 1 See also Refer...

Страница 26: ...ter the network name of your target here The value given in this field overwrites the value in the Address field of the Streamline Data view if one has been given The reverse is also true If you enter a new address in the Address field of the Streamline data view it replaces the value entered here Note By default Streamline uses port 8080 to connect to a target To use a different port specify one ...

Страница 27: ...y streaming data from the target to the host Duration The length of the capture session in seconds For example enter 1 05 for 1 minute and 5 seconds If you do not provide a value here the capture session continues until you stop it manually Call stack unwinding Select this checkbox to ensure that Streamline records call stacks This greatly improves your visibility into the behavior of your target ...

Страница 28: ...s that apply to each channel Power When checked Streamline collects power data on this channel Voltage Check this box to collect voltage data on this channel Current When this option enabled Streamline collects current information for the chosen channel Resistance Use this field to define the value in milliohms of the shunt resistor that connects to each of the available channels The default setti...

Страница 29: ...icrosecond bin sizes This option does not affect the data collected during the capture session It only affects the Analysis Report automatically generated after the termination of the capture session This option can be changed when you re analyze the stored Capture Data 4 2 4 The Program Images section Use this area to explore your file system and define all of the images and libraries that you wa...

Страница 30: ...nfidential Chapter 5 Configuring Counters The following topics describe how to open the Counter Configuration dialog box and describe each of the settings it contains Opening the Counter Configuration dialog box on page 5 2 Using the Counters Configuration dialog box on page 5 4 ...

Страница 31: ...ons dialog box 1 Make sure that you have the Streamline Data view open Figure 5 1 The Streamline data view To open the Streamline Data view select Window Show View Other and choose it from the ARM Streamline folder 2 Click Counter Configuration located in the upper right of the Streamline Data view Figure 5 2 The Counter Configuration button Note To open the Counter Configuration dialog box you mu...

Страница 32: ...ounters ARM DUI 0482K Copyright 2010 2012 ARM All rights reserved 5 3 ID120712 Non Confidential 5 1 1 See also Reference Using the Counters Configuration dialog box on page 5 4 The Streamline Data view on page 3 2 ...

Страница 33: ...mber of events that you can add Events that appear in gray are already in the Events to Collect list The maximum number of available events and the amount remaining are in the upper right hand corner of the Available Events list When you have reached this maximum all entries in the category list are grayed out and you cannot add any additional events to the Events to Collect list Note These availa...

Страница 34: ...T6xx target there are many additional options in the counter configuration dialog For information about the meaning of each of the Mali specific counters and how to interpret the profiling data please read the Mali GPU Application Optimization Guide available on the Mali developer site http www malideveloper com When choosing which Mali events to add to the Events to Collect list consider the foll...

Страница 35: ...ing When you have enabled events based sampling Streamline samples only when the selected event is triggered a number of times equal to the value in the Threshold field and does so for each core on your target For example to trigger a sample every time a core causes 500 L2 cache misses select L2 miss from the Events to Collect list and enter 500 in the Threshold field Given an adequate capture ses...

Страница 36: ... search for an xml file that you previously generated Export Exports the current counters configuration to an xml file You can create the xml file and manually add as an option when running gatord on the target if you choose to capture data locally Save Saves your current counter configurations and exits the dialog box The counter configuration file is saved to your target Cancel Exits the Counter...

Страница 37: ...ing topics describe the Timeline view and how to use it About the Timeline view on page 6 2 Timeline view charts on page 6 10 Filtering data and other Timeline view controls on page 6 19 Timeline view toolbar options contextual menu options and keyboard shortcuts on page 6 22 Visual Annotation in the Timeline view on page 6 25 ...

Страница 38: ... bin in the processes section represents trace data captured during a 100ms window 6 1 1 Charts Streamline collects data for the charts from hardware and software performance counter resources The data is dependent on how you have configured your counters and the type of system you use For SMP systems the chart disclosure control enables you to expand the data to show collection either per core or...

Страница 39: ...elected processes and threads All charts that do not contain the necessary process information are blanked out Each of the multi threaded or annotated processes in the list have a disclosure control Use the control to show each of the threads and annotations for that process Annotations shown here can be hierarchical with annotation groups each containing a set of channels as defined by the macros...

Страница 40: ...the toolbar Figure 6 5 Timeline Detail Bar 6 1 4 X Ray mode X Ray mode changes the process trace from an intensity map of time to a mode that highlights core or cluster affinity In this mode the bars show the mapping of software threads to processor cores or clusters If there are clusters present on a target the X Ray mode has several different levels that you can cycle through Click the X Ray but...

Страница 41: ...ilter The process filter is located on the right hand side of the toolbar Enter a regular expression in the field to filter the processes in the processes section of the Timeline view For example if you enter a standard string consisting only of letters the processes section updates to include only idle kernel and any processes that contain the entered string Regular expression strings are case se...

Страница 42: ...ee an overlay that shows you the title of the bookmark and the time in the capture session The overlay also provides two buttons Edit bookmark Use this button to change the title or color of the bookmark Double clicking on a bookmark has the same effect Delete bookmark Use this button to remove the bookmark from the Timeline If you scroll away from the bookmark you can easily return to it by click...

Страница 43: ...s button If you click a Processes Focus button on one of the bar charts the processes section updates to show a heat map of processes that contributed to activity in the newly selected bar chart For example if you click the Processes Focus button on the GPU Vertex chart the processes section updates to show heat mapped activity for the GPU vertex processor only The GPU charts are only available if...

Страница 44: ...g The tooltip that appears when you hover the mouse over the EBS tag tells you which counter you set as the basis for the events based sampling and the threshold value For more information on events based sampling see Events based sampling on page 5 6 6 1 11 The Energy Offset menu The Energy Offset menu is located in the bottom left hand corner of the Timeline view next to the Snippets menu Use it...

Страница 45: ...by 1ms Use the left arrow button to move power data back The Reset button in the middle to returns the power data to its original position 6 1 12 See also Tasks Customize reports using Annotate on page 10 2 Creating custom performance counters on page 11 4 Reference Timeline view charts on page 6 10 Filtering data and other Timeline view controls on page 6 19 Timeline view toolbar options contextu...

Страница 46: ...he core was forced to wait due to contention as a percentage This is a binary indicator When the task is waiting this value is 100 otherwise it is 0 Use the tall thin Process Focus button on the left side of the CPU Wait Contention chart handle to change the coloring of the processes and show levels of contention For more information on how to set up your Linux kernel to provide CPU wait data see ...

Страница 47: ...amline reports whether the status of the Mali 400 vertex processor is idle or active The load on the vertex processor is proportional to the number of vertices and the complexity of the shader used to transform their coordinates GPU Fragment chart Streamline reports whether the status of the Mali 400 fragment processor is idle or active The load on the fragment processor is proportional to the num...

Страница 48: ...The Timeline View ARM DUI 0482K Copyright 2010 2012 ARM All rights reserved 6 12 ID120712 Non Confidential Timeline view toolbar options contextual menu options and keyboard shortcuts on page 6 22 ...

Страница 49: ... CacheDataAccess counter while Data refill uses CacheDataRefill In the toolbar the Cache chart is defined as a Stacked chart so the Timeline view draws it as two stacked line graphs 6 3 1 Chart Configuration toolbar options Use the toolbar of the Chart Configuration panel to define chart options that apply to all series in a chart Figure 6 19 The Chart Configuration panel toolbar The toolbar of th...

Страница 50: ...appropriate when some of the events are counted in more than more series in the same chart Data Read Requests and Data Read Hits are a good example of this Bar In a bar style chart each bin in the chart is represented by a colored bar Like the stack view values from higher series are stacked on top of values from lower series and the total bar height represents the aggregate Figure 6 22 A bar char...

Страница 51: ...t side of each series control to change the order the series appears in the chart Click and drag a series control until it is in your desired place in the order Each series in a chart contains the following options Color To change the color of a series in the Timeline view click on the color box in its series control This opens the color dialog box Figure 6 24 The Color dialog box on Windows Note ...

Страница 52: ...ric expression floor Returns the largest integer that is less than or equal to a numeric expression given as a parameter Usage floor x where x is a numeric expression max Returns the maximum value over the entire capture from the given numeric expression Usage max x where x is a numeric expression min Returns the minimum value over the entire capture from the given numeric expression Usage min x w...

Страница 53: ...ort Try re configuring your counters using the Counter Configuration dialog box and run another capture session to add these charts populated with data To move snippets in the Snippets drag and drop them in the desired location To re order a snippet move it up and down in the list To move a snippet from one category to another drag the snippet to the category header and hover for a second Figure 6...

Страница 54: ...he location defined in the Export dialog box This option is useful if you want to carry over your saved snippets to another Eclipse installation Snippet contextual menu options The following options are available if you right click on a snippet in the Snippets menu Rename Snippet Choose this option and the snippet title changes to a field that enables you to rename the snippet Delete snippet Remov...

Страница 55: ...rt in the Timeline view using a control on the bottom edge of the chart handle control Figure 6 27 Re sizing a chart All series expand to fill the new height Increasing the size of a charts provides a higher level of graphical detail highlighting the variance in values 6 4 1 Filtering using the caliper controls The Timeline view contains calipers that you can use to set the specific window of time...

Страница 56: ...meline view shows a chart for every core in your system Click a third time and the chart returns to its default state 6 4 3 Re ordering charts and processes using the handle controls Each chart and process has a rounded box on the left that contains the title and in the case of charts a color coded key You can also use these rounded bars called handles to drag and drop individual charts and proces...

Страница 57: ...the current Cross Section Marker Note Unlike the filter controls moving and expanding the Cross Section Marker does not have an effect on the data in the other report views 6 4 5 The divider The divider bar that separates the charts from the processes section is also a control Click and drag the divider up and down to change the proportion of the window that the charts and processes sections use D...

Страница 58: ...s while turquoise indicates that the second processor did Amber represents the third core and purple the fourth In a single core system all active areas in the Processes section are blue Hover over a color in the processes for a tooltip that tells you which core the color represents Reset filtering Reset the calipers The calipers are the blue arrow controls at the top of the Timeline view that you...

Страница 59: ...ll data before the left caliper from all views Set right caliper Sets the right caliper control to the current location Streamline filters all data after the right caliper location from all views Reset calipers Resets calipers to their default locations The left caliper returns to the start of the capture session and the right caliper to the end Set Cross Section Marker start index Sets the left h...

Страница 60: ... one bin to the right Shift left arrow Contracts the width Cross Section Marker if it is wider than one bin Shift right arrow Expands the width of Cross Section Marker L Opens the Log tab and highlights the annotation indicated by the Cross Section Marker S Reveals or hides the Samples HUD X Turns X Ray mode on and off I Ctrl Zooms the Timeline view in one level O Ctrl Zooms the Timeline view out ...

Страница 61: ...over the images in a visual annotation chart shows you the image for the current position of the mouse If there is more than one image in the twenty bin range covered by each thumbnail pictured in a visual annotation chart Streamline uses the first image from the range Moving the mouse over that thumbnail reveals the other annotated images in that twenty bin range Hover over an image in the Timeli...

Страница 62: ...M DUI 0482K Copyright 2010 2012 ARM All rights reserved 6 26 ID120712 Non Confidential Figure 6 35 Text with visual annotation Hover over a blue marker and the text associated with that image appears above the upper marker ...

Страница 63: ... rows for each function and columns for each statistical category The following topics describe the common functionality of the table views and then breaks down the statistics available in each of them Table views toolbar options contextual menu options and keyboard shortcuts on page 7 2 Sorting data in the table reports on page 7 5 Call Paths view column headers on page 7 6 Functions view column ...

Страница 64: ...hs view only Shows the entire hierarchy It has the effect of opening disclosure controls to reveal all processes thread and functions Fully collapse all rows Call Paths view only Hides all children in the entire hierarchy It has the effect of closing all disclosure controls 7 1 2 Contextual menus To open a contextual menu right click in any table The following options are available from contextual...

Страница 65: ...eyboard shortcuts available for the table views are Up arrow Moves the current selection up one row Shift Up Arrow Adds the previous row to the current selection Down arrow Moves the current selection down one row Shift Down Arrow Adds the next row to the current selection Home Selects the first row in the active table report End Selects the last row in the active table report Page Up Moves up in ...

Страница 66: ...ing the left arrow by itself but when the subordinate process thread and functions are again revealed this command ensures that only their immediate subordinates appear 7 1 4 See also Reference Filtering data and other Timeline view controls on page 6 19 Sorting data in the table reports on page 7 5 Call Paths view column headers on page 7 6 Functions view column headers on page 7 7 Stack view col...

Страница 67: ...rocess Thread Function Name header Your Call Paths view now looks like the one pictured Figure 7 1 A multi level sort Sorting in the Call Paths view works differently than in the other report types You can still click various columns to add sort criteria and change the direction of the sorts but the sort criteria does not break the integrity of the call paths so the hierarchy of the call paths is ...

Страница 68: ...sed by the stack in this function A question mark is presented if the stack usage of the function is unknown Process Thread Function Name The name of the process thread or function Note If you disabled call stack unwinding in the Capture Options dialog box the sampled functions all appear directly under the threads in the Call Paths view For more information on call stack unwinding see Capture opt...

Страница 69: ... Paths view Function Name The name of the function Location This column reports the location of the function listing both the file name and line of the declaration Image The image file that contains the function Note All data in the Functions view is dependent on the filtering selection in the Timeline view If you have used the caliper controls to filter data in the Timeline view the data in the F...

Страница 70: ...bytes used by the stack in this function A question mark appears next to the total here if the function s stack usage is unknown Try turning on Call stack unwinding in the Capture Options dialog box for best results in this view Size The total size of the function in bytes Function Name The name of the function as specified in the source code Location This column reports the location of the functi...

Страница 71: ...l of the views available in ARM Streamline the Code view provides the highest level of detail It breaks statistics down by individual line of code and disassembly instruction The following topics describe the use of the Code view Code view basics on page 8 2 Code view toolbar options and keyboard shortcuts on page 8 5 ...

Страница 72: ...imeline view If you have used the caliper controls to filter data in the Timeline view the data in the Code view reflects this selection 8 1 1 Code view selection behavior Selecting code in the Code view highlights related instructions in the disassembly panel This feature ignores coding comments Click an instruction in the disassembly panel to select all of the instructions that relate to a singl...

Страница 73: ...more are present off screen Figure 8 3 The More indicator Click the More indicator to see additional selected rows 8 1 2 Locating missing source files ARM Streamline automatically locates and displays the source code in the source view If however the source files are not located in the same directory location they were in during compilation the source view is not populated Figure 8 4 Missing sourc...

Страница 74: ...s for a function name or a hexadecimal instruction address use the Find field located just below the toolbar Figure 8 6 The Find field Enter a string and the field on the right hand side updates to show the current match if there is one Pressing the Enter key takes you to the first match in the code and subsequent presses of the Enter key cycles through all of the available matches 8 1 4 See also ...

Страница 75: ...sing or you ve previously selected an out of sync source file 8 2 2 Keyboard shortcuts While you can navigate every report in ARM Streamline using the mouse you can also use keyboard shortcuts The keyboard shortcuts available for the table views are Up arrow Moves the current selection up one row Shift Up Arrow Adds the previous row to the current selection Down arrow Moves the current selection d...

Страница 76: ...e Code View ARM DUI 0482K Copyright 2010 2012 ARM All rights reserved 8 6 ID120712 Non Confidential Reference Code view basics on page 8 2 The Streamline Data view on page 3 2 Capture options on page 4 3 ...

Страница 77: ...your code hierarchy Streamline places every called function in a tree and connects calling and called functions with arrows It includes many controls that aid you in navigation The following topics describe the Call Graph view and how to use it Call Graph view basics on page 9 2 Contextual menu options on page 9 5 Call Graph toolbar and keyboard shortcuts on page 9 6 ...

Страница 78: ...lumn to the right of that and so on down the line until all of the functions have been placed There is a caveat to this placing behavior If a function is called at multiple levels of the hierarchy it is placed as far left as possible in the Call Graph view To illustrate if the function main calls function a which in turn calls function b it looks like this Figure 9 1 A Simple Call Hierarchy If in ...

Страница 79: ...ck and drag the view area Panning the view area in this way enables you to quickly scan sections of the hierarchy without using the scroll bars The objects in the mini map have the same color coding as the functions in the Call Graph view itself The bright red function in the hierarchy appears as bright red in the mini map so that you can use the mini map to quickly zoom to a bottleneck Selected f...

Страница 80: ...erved 9 4 ID120712 Non Confidential Figure 9 5 A Selected Function Selecting a function also changes any connected caller or callee bullets from gray to black 9 1 6 See also Reference Call Graph toolbar and keyboard shortcuts on page 9 6 Contextual menu options on page 9 5 ...

Страница 81: ...is the root function the Call Graph view grays out this menu option Callees This menu option works identically to the Callers menu option only it contains a selectable list of functions that are called by the selected function If the selected function does not call any functions the Call Graph view grays out this menu option Select Callers Selects every function that called the selected functions ...

Страница 82: ...ni map visibility on and off Edit Source Edit the source file that contains the selected function You can also use the following keyboard shortcuts to navigate the Call Graph view Up arrow Moves the current selection up one function box Down arrow Moves the current selection down one function box The down arrow does not move the selection to the uncalled and disconnected functions These must be se...

Страница 83: ...he Call Graph View ARM DUI 0482K Copyright 2010 2012 ARM All rights reserved 9 7 ID120712 Non Confidential 9 3 1 See also Reference Call Graph view basics on page 9 2 Contextual menu options on page 9 5 ...

Страница 84: ...s Reports In addition to the color coded overlays it adds to the Timeline view the Annotate feature records each message generated by the inserted Annotate code and lists it in the Log view The following topics describe the Log view and how to use the Annotate feature Customize reports using Annotate on page 10 2 Adding images to reports using Visual Annotate on page 10 7 The Log view on page 10 9...

Страница 85: ...entifier that keeps the data uncluttered and eliminates the necessity of user mutexes Writing to the annotate file is handled by the standard C library functions The application code accesses the virtual annotate file using the standard c library functions fopen fwrite and fprintf To start using the annotate feature do the following 1 Ensure gatord is running gatord creates the dev gator annotate ...

Страница 86: ...es section of the Timeline view Each annotation channel appears on its own line under the thread Channels may also be sorted by groups and displayed under a group name that you define using the ANNOTATE_NAME_GROUP macro ANNOTATE_COLOR color string Works the in the same way as the basic ANNOTATE macro only use the color variable to define an interface display color for the annotation string ANNOTAT...

Страница 87: ...tras from the main menu See the streamline_annotate h located here for a better understanding of how to call each annotate macro 10 1 1 See also Tasks Adding bookmarks using Annotate on page 10 5 Capturing data on your target on page 11 2 Creating custom performance counters on page 11 4 Reference About the Timeline view on page 6 2 Filtering data and other Timeline view controls on page 6 19 ...

Страница 88: ...ATE_MARKER Use this function to add a a red bookmark to the Timeline view without a title It has no parameters ANNOTATE_MARKER_STR This function adds a marker to the Timeline view with a title Pass a string as a parameter to ANNOTATE_MARKER_STR and the Timeline view displays it when you hover over the bookmark ANNOTATE_MARKER_COLOR setColor This functions adds a bookmark and assigns it a color Pas...

Страница 89: ...nd the Log View ARM DUI 0482K Copyright 2010 2012 ARM All rights reserved 10 6 ID120712 Non Confidential Reference About the Timeline view on page 6 2 Filtering data and other Timeline view controls on page 6 19 ...

Страница 90: ...ion on text only annotation see Customize reports using Annotate on page 10 2 To include images in the data sent to the host during a capture session use the ANNOTATE_VISUAL macro in your source code instead of the ANNOTATE and ANNOTATE_COLOR macros used in standard annotation ANNOTATE_VISUAL provides a parameter for image data Note You can locate all of the files provided by DS 5 by selecting Hel...

Страница 91: ...ee the annotate c example source file located in gator annotate example Note When you annotate from within the kernel or a module you do not need to use ANNOTATE_DEFINE and ANNOTATE_SETUP Kernel annotations are not supported in interrupt context You can see the effects of visual annotation in the Timeline and Log views of your Streamline Analysis Reports With visual annotation the Timeline view da...

Страница 92: ...w search fields The Log view provides three search fields above the table data that enable you to find particular messages based on the field type you use and the regular expression that you enter The regular expression in the search field acts as a filter Only messages that contain the matching pattern appear in the list sorted in the chronological order Message Search the message field for a str...

Страница 93: ...TATE If an annotation message contains an image a camera icon appears in the Message column Select a row with a camera icon to see the image Figure 10 6 Visual annotation in the Log view Core The core that generated the message Where The process and thread that generated the message 10 4 3 Log view totals panel The totals panel provides additional information when you select multiple messages in t...

Страница 94: ...to include all of the selected entries Select Process Thread in Timeline Opens the Timeline view with the cross section marker moved to the location of the selected annotation message Select in Call Paths Opens the Call paths view All functions related to the selection in the Log view are selected in the Call paths view 10 4 5 See also Tasks Customize reports using Annotate on page 10 2 Creating c...

Страница 95: ...difying XML files However if you want to customize the data that ARM Streamline collects and change how it is presented to you or you want to capture data and store it on your target advanced customizations are required The following topics describe how capture data locally use the Annotate feature and customize performance counters Capturing data on your target on page 11 2 Creating custom perfor...

Страница 96: ...able to something other than streaming Use one of the following values Large Normal or Small A Large store and forward buffer is 16MB while Normal is 4MB and Small is 1MB The profiling session terminates automatically when it reaches the set buffer size Press Ctrl C on the console to interrupt the gator daemon The daemon must be running in the foreground Determine the process id of gatord and ente...

Страница 97: ...a view to open the Analyze dialog box 11 1 1 Example session xml xml version 1 0 encoding US ASCII session version 1 output_path x call_stack_unwinding yes parse_debug_info yes high_resolution no buffer_mode streaming sample_rate normal duration 0 target_host snowball target_port 8080 session 11 1 2 See also Tasks Customize reports using Annotate on page 10 2 Creating custom performance counters o...

Страница 98: ...ovided by DS 5 by selecting Help ARM Extras from the main menu To familiarize yourself with the process of adding your own counters incorporate the simulated examples from gator_events_mmaped c into gator To do so follow these steps 1 Open the gator_events_mmaped c sample file in the editor of your choice 2 Copy the xml from the comments section of gator_events_mmaped c 3 Open events xml This file...

Страница 99: ...eprocessor directive include gator h if you do not use gator_events_mmaped c as a template 4 Include the gator_events_init macro 5 Implement the following functions in your new source file gator_events_your_custom_init gator_events_your_custom_interface gator_events_your_custom_create_files gator_events_your_custom_start gator_events_your_custom_read and gator_events_your_custom_stop 6 All of your...

Страница 100: ...nter how many counters are available for the count attribute For example counter_set name ARM_Cortex A9_cnt count 6 2 For each counter set you must list each of the possible events Define the event category using the category tag The category node has the following attributes name A name for this category of counters This names the header the counter appears under in the counter configuration dial...

Страница 101: ...efault value is accumulate units Defines the unit type to display in Streamline average_selection Enter yes to have the values of the Cross Section Marker in the Timeline view display as average Enter no to have them display as a total description Use this attribute to define a description to show in Streamline The value of this attribute is used as the tooltip for the counter A basic event exampl...

Страница 102: ... 2010 2012 ARM All rights reserved 11 8 ID120712 Non Confidential 5 Connect to your target 11 2 6 See also Tasks Capturing data on your target on page 11 2 Customize reports using Annotate on page 10 2 Reference About the Timeline view on page 6 2 ...

Страница 103: ...Data view 2 Double click on a stored Streamline Capture Data resource in the list 3 In the resulting dialog box make the required changes to the settings Figure 11 2 The Analyze dialog box The options here are a subset of the options available in the Capture Options dialog box and they work the same way Use the checkboxes of the Analysis section to toggle the High Resolution Timeline and Process D...

Страница 104: ...rs using this method Statically link the driver into the kernel image or add the module as an image in the capture options dialog box 11 4 1 Kernel stack unwinding Unless you build gator ko with kernel stack unwinding specifically turned on the data related to the kernel in the Call paths view appears flat It does represent an accurate call hierarchy To perform kernel stack unwinding and module un...

Страница 105: ...s The combination of ARM Streamline and Energy Probe enables the visualization of power metrics against the software behavior of your target hardware It provides a better understanding of the static and dynamic behavior of your target system for the purposes of debugging profiling and analysis The following topics describe how to use the Energy Probe Energy Probe overview on page 12 2 Energy Probe...

Страница 106: ... is designed to connect to a 2 pin header for measuring the power This allows the energy probe to provide three independent power current or voltage measurements Figure 12 1 Energy Probe schematic In addition to the three power connectors the Energy Probe has a single pin GND connector that must be connected to ground on your target board It provides a ground connection for the Energy Probe Each o...

Страница 107: ...g so could cause damage to your Energy Probe or the power supply of your target 12 2 2 Determining the optimal shunt resistor value With 20x amplification Energy Probe requires correct selection of a shunt resistor to provide the best possible dynamic range in power measurement while avoiding saturation of the input of Energy Probe A shunt resistor with a value too low reduces measurement dynamic ...

Страница 108: ...y Probe consider the following The black and white probe closest to the green wire is Channel 0 For best results attach Channel 0 to the power source which best represents the CPU load Streamline aligns the power data with the software activity by maximizing the correlation of Channel 0 with the CPU load The probe white wire is V The black wire is V ...

Страница 109: ...ty device To do so enter the following command usermod a G Group_Name User_Name Note dialout is the usual name of the group for the tty device When you have installed the driver and it is operating correctly the LED remains green Attaching a probe backwards to Energy Probe or the target causes the LED to turn red Backwards connections do not damage your target or Energy Probe but this kind of conn...

Страница 110: ...e available for caiman or the firmware follow these instructions to update your software 1 Detach the Energy Probe probes and ground from the target 2 Copy the file eprobe_firmware bin to a local folder on your Windows machine Note Because of a limitation with the USB bootloader from the MCU vendor updating firmware on Linux is not supported 3 Plug the Energy Probe into a USB port 4 To enable firm...

Страница 111: ...D120712 Non Confidential 8 Drag and drop the new eprobe_firmware bin file onto the drive folder 9 Safely remove the Energy Probe drive from the machine using the Windows Safely Remove driver icon 10 Unplug the Energy Probe from the machine 11 Wait for about one second and plug it back in ...

Страница 112: ... variance between idle and activity ensures that the correlation algorithm has something to lock onto so set your workloads accordingly If you have connected and configured your Energy Probe correctly a power chart now appears in the Timeline view Figure 12 4 Energy Probe in the Timeline view 12 4 1 Adding the caiman application to Streamline To configure Energy Probe select the ARM Energy Probe o...

Страница 113: ...o power can be offset manually using the Energy Offset menu located in the bottom left of the Timeline view Use the left and right arrows to move the power data left and right until it lines up appropriately with the other data in the Timeline view The Reset button in the middle to returns the power data to its original position Figure 12 6 The Energy Offset menu ...

Страница 114: ...e http www ni com 12 5 2 Setup To connect the NI DAQ device to your target and measure one channel follow these steps 1 Connect the Ai1 connections on the NI DAQ device to go across the shunt resistor on your target 2 Connect Ai0 negative to ground 3 Loop Ai0 positive to Ai1 negative The Ai0 connectors is measured across the load which is used to derive the voltage Note To measure additional chann...

Страница 115: ...l Chapter 13 Using Streamline on the Command Line Note The feature is only available in the full DS 5 installation The following topic describes how to use Streamline on the command line Opening a Streamline enabled command prompt or shell on page 13 2 The streamline command on page 13 3 ...

Страница 116: ...120712 Non Confidential 13 1 Opening a Streamline enabled command prompt or shell To use Streamline on the command line open a DS 5 command prompt On Windows select Start All Programs ARM DS 5 DS 5 Command Prompt On Linux add the bin location to your PATH environment variable then open a UNIX bash shell ...

Страница 117: ...r instructions on how to create a session xml file manually see Capturing data on your target on page 11 2 analyze Use this mode to analyze existing Capture Data You must enter a valid apc capture file after analyze For example streamline analyze threads_001 apc For more information on the analyze feature see Using Stored Streamline Capture Data to create new Streamline Analysis Reports on page 11...

Страница 118: ...ession xml The following options are unique to report mode all Outputs the contents of the Timeline Call Paths Functions Stack and Log views This is the default option callpath Outputs the contents of the table data of the Call Paths view Subordinate functions are indented Figure 13 2 The call paths report on the command line function Outputs the contents of the Functions view stack Outputs the co...

Страница 119: ...d from the output bstop seconds Filter the data to end at the first bookmark with the provided name format space tab csv Use this option to specify the format of the output Format the tables using spaces tabs or comma separated values This can be useful if you want to easily convert output text files to your favorite spreasheet program The default format is spaces making the tables easy to read wh...

Страница 120: ...imeline view in a text file 13 2 5 See also Tasks Using Stored Streamline Capture Data to create new Streamline Analysis Reports on page 11 9 Reference Call Paths view column headers on page 7 6 Functions view column headers on page 7 7 Stack view column headers and the Maximum Stack Depth by Thread chart on page 7 8 The Log view on page 10 9 ...

Страница 121: ...0 2012 ARM All rights reserved 14 1 ID120712 Non Confidential Chapter 14 Troubleshooting The following topics describe how to troubleshoot common Streamline issues Target connection issues on page 14 2 Report issues on page 14 3 ...

Страница 122: ... firewalls on your host machine that might be interfering with communication between it and the target Symptom You receive the following error message Unknown host Solution Make sure that you have correctly entered the name or IP address of the target in Address field If you have entered a name try an IP address instead Symptom You receive the following error message Unable to launch Only one inst...

Страница 123: ...e is a list rather than a hierarchy Solution Use the fno omit frame pointer and marm options during compilation and be sure to check the Call Stack Unwinding option in the capture options dialog box Note Streamline does not walk the stack for kernels loadable kernel modules or statically linked drivers These generate flat data in the call paths view Symptom Functions that you know are highly used ...

Отзывы: