C4.7
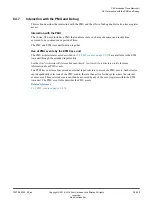
Interaction with the PMU and Debug
This section describes the interaction with the PMU and the effect of debug double lock on trace register
access.
Interaction with the PMU
The Cortex-A76 core includes a PMU that enables events, such as cache misses and instructions
executed, to be counted over a period of time.
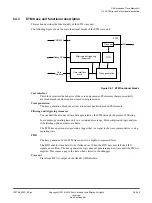
The PMU and ETM trace unit function together.
Use of PMU events by the ETM trace unit
The PMU architectural events described in
are available to the ETM
trace unit through the extended input facility.
See the
Arm
®
Architecture Reference Manual Armv8, for Armv8-A architecture profile
for more
information about PMU events.
The ETM trace unit uses four extended external input selectors to access the PMU events. Each selector
can independently select one of the PMU events, that are then active for the cycles where the relevant
events occur. These selected events can then be accessed by any of the event registers within the ETM
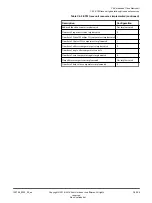
trace unit. The PMU event table describes the PMU events.
Related references
C2.3 PMU events
on page C2-374
C4 Embedded Trace Macrocell
C4.7 Interaction with the PMU and Debug
100798_0300_00_en
Copyright © 2016–2018 Arm Limited or its affiliates. All rights
reserved.
C4-399
Non-Confidential
Содержание Cortex-A76 Core
Страница 4: ......
Страница 22: ......
Страница 23: ...Part A Functional description ...
Страница 24: ......
Страница 119: ...Part B Register descriptions ...
Страница 120: ......
Страница 363: ...Part C Debug descriptions ...
Страница 364: ......
Страница 401: ...Part D Debug registers ...
Страница 402: ......
Страница 589: ...Part E Appendices ...
Страница 590: ......


