


Chapter 4 Examining Chromatogram Data
4-12
Applied Biosystems
4
Example
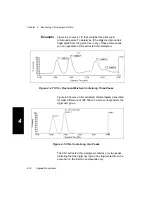
Figure 4-4 shows a TIC that contains three flavonoid
compound peaks. To determine if the diglycosyl group has
fragmented from the parent ion in any of these compounds,
you can generate a CNL extracted chromatogram.
Figure 4-4 TIC for Flavonoid Mixture Containing Three Peaks
Figure 4-5 shows a CNL extracted chromatogram generated
for mass difference of 308.146 m/z which corresponds to the
diglycosyl group.
Figure 4-5 CNL Containing Two Peaks
The CNL extracted chromatogram contains only two peaks,
indicating that the diglycosyl group has fragmented from the
parent ion in the first two compounds only.
Содержание Data Explorer 4 Series
Страница 1: ...Data Explorer Software Version 4 Series Software User Guide ...
Страница 10: ...Table of Contents x Applied Biosystems ...
Страница 56: ...Chapter 1 Data Explorer Basics 1 42 Applied Biosystems 1 ...
Страница 98: ...Chapter 2 Using Chromatogram and Spectrum Windows 2 42 Applied Biosystems 2 ...
Страница 172: ...Chapter 3 Peak Detection and Labeling 3 74 Applied Biosystems 3 ...
Страница 204: ...Chapter 4 Examining Chromatogram Data 4 32 Applied Biosystems 4 ...
Страница 270: ...Chapter 5 Examining Spectrum Data 5 66 Applied Biosystems 5 ...
Страница 316: ...Chapter 6 Using Tools and Applications 6 46 Applied Biosystems 6 ...
Страница 384: ...Chapter 9 Troubleshooting 9 22 Applied Biosystems 9 ...
Страница 388: ...Appendix A Warranty A 4 Applied Biosystems A ...
Страница 416: ...Appendix C Data Explorer Toolbox Visual Basic Macros C 20 Applied Biosystems C ...
Страница 446: ...I D E X N Index 30 Applied Biosystems ...


