


Chapter 3 Peak Detection and Labeling
3-4
Applied Biosystems
3
The software uses the following formula to calculate the
expected number of data points in a peak:
Detection ranges
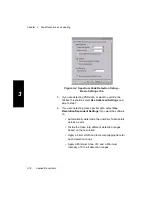
Figure 3-1 is an example of the resolution-based detection
ranges automatically calculated by the software.
Figure 3-1 Example Detection Ranges Calculated by Software Based on Number
of Data Points Per Peak
number of
Flight time
data points
(2 × mass resolution × Bin size)
to which the
data point corresponds
=
Where:
·
For Mariner data, Bin size = 1 ns.
Bin size is an instrumental constant:
Mass resolution is a user-defined value.
Data-type-dependent defaults are provided, but can be overwritten.
Expected
·
For Voyager data, Bin size is variable based on
the digitizer used and the mass range acquired.
41
47 53
59
65
71
77
83
Number
of data points
Содержание Data Explorer 4 Series
Страница 1: ...Data Explorer Software Version 4 Series Software User Guide ...
Страница 10: ...Table of Contents x Applied Biosystems ...
Страница 56: ...Chapter 1 Data Explorer Basics 1 42 Applied Biosystems 1 ...
Страница 98: ...Chapter 2 Using Chromatogram and Spectrum Windows 2 42 Applied Biosystems 2 ...
Страница 172: ...Chapter 3 Peak Detection and Labeling 3 74 Applied Biosystems 3 ...
Страница 204: ...Chapter 4 Examining Chromatogram Data 4 32 Applied Biosystems 4 ...
Страница 270: ...Chapter 5 Examining Spectrum Data 5 66 Applied Biosystems 5 ...
Страница 316: ...Chapter 6 Using Tools and Applications 6 46 Applied Biosystems 6 ...
Страница 384: ...Chapter 9 Troubleshooting 9 22 Applied Biosystems 9 ...
Страница 388: ...Appendix A Warranty A 4 Applied Biosystems A ...
Страница 416: ...Appendix C Data Explorer Toolbox Visual Basic Macros C 20 Applied Biosystems C ...
Страница 446: ...I D E X N Index 30 Applied Biosystems ...


