F
el
= −
1
2
d
C
d
z
U
2
.
(5)
A possible voltage dependency of C is neglected in this consideration.
The voltage
U
contains a direct voltage part
U
DC
and an alternating voltage part
U
AC
:
U
=
U
DC
U
AC
⋅
cos
ref
t
.
(6)
U
DC
consists of an additional applied bias voltage and, what is especially interesting from
the physical point of view, potential differences caused by different electronic work
functions and charges. For separating the impact of these electrical forces from other
forces (e.g. van der Waals forces),
U
has to be modulated at the frequency
ω
ref
.
As a
result of this, the measurable photo-detector signal is modulated, too.
Inserting equation (6) in (5) and using power-reduction formulas of trigonometric
functions one can expect a force between tip and sample at the frequency ω
ref
as well as
at
2·
ω
ref
.
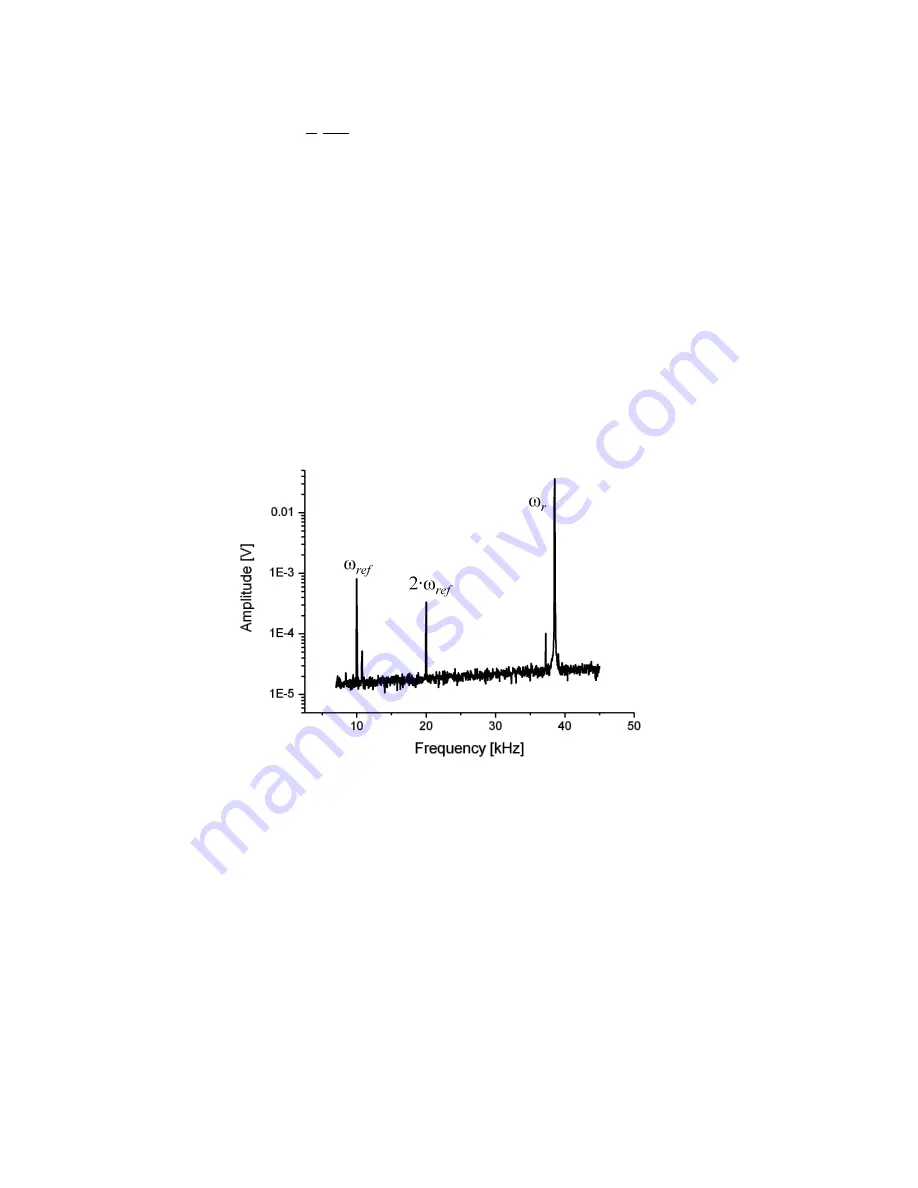
Figure 5 confirms this prediction: It shows the frequency spectrum of the
cantilever oscillation with clear signals at the mechanical excitation frequency
ω
r
and at
the frequencies of the first and second harmonic of the electrical excitation.
Now two additional lock-in amplifiers (see Figure 4) can be used to analyze the photo-
detector signal at the frequency
ω
ref
and
2·
ω
ref
simultaneously. The measured amplitudes
of the signals are proportional to the strength of the electrical forces.
15 (58)
Figure 5: Frequency spectrum of the oscillating cantilever
Содержание eLockIn 203
Страница 52: ...7 APPENDICES 7 1 SCHEMATIC DIAGRAM OF THE SIGNAL PATHS 52 58...
Страница 53: ...7 2 DIAGRAM OF THE LOCKIN AMPLIFICATION PATHS Diagram of the preamplifier switches 53 58...
Страница 54: ...7 3 FRONTPANEL DIMENSIONS 54 58...
Страница 55: ...7 4 INSTRUMENT SPECIFIC TEST SHEETS insert with 10 pages of data 55 58...
Страница 56: ...7 5 PREAMPLIFIER CONNECTOR PINOUT 56 58...
Страница 58: ...7 7 TRACEABILITY CHART 58 58...


