UG-1635
Rev. 0 | Page 10 of 30
USING THE EVALUATION SOFTWARE
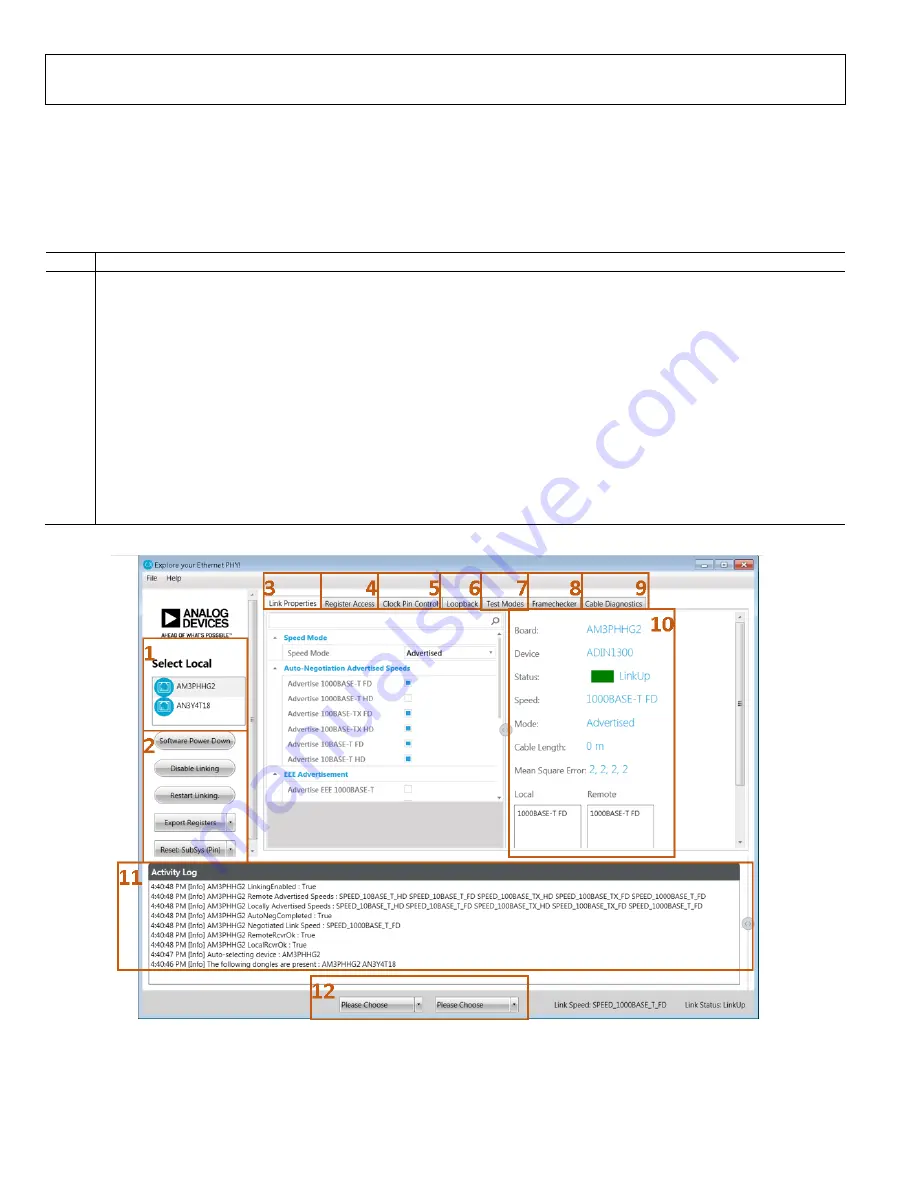
When the Ethernet PHY software is launched, the GUI window
shown in Figure 12 appears. Figure 12 shows the GUI features
with labels, and Table 6 lists the GUI labels and the
corresponding descriptions.
Table 6. GUI Label Descriptions
Label Description
1
Select Local
section.
Shows connected evaluation hardware. The board name shown corresponds to the MDIO interface dongle
that is connected to the EVAL-ADIN1300FMCZ.
2 User
buttons.
3
Link Properties
tab. Use this tab to change the PHY configuration.
4
Register Access
tab. Allows the user read or write device registers.
5
Clock Pin Control
tab. Controls which clock is applied to the GP_CLK pin and enables the CLK25_REF pin.
6
Loopback
tab. Controls the various loopback modes.
7
Test Modes
tab. Provides access to the various test modes on the device.
8
Framechecker
tab. Configures and enables the frame generator and frame checker.
9
Cable Diagnostics
tab. Provides easy access to the cable diagnostics features on the device.
10
Activity information window. This window provides an overview of the PHY activity, reads, and writes issued to the device.
11
Activity Log
section. Section shows read, write, and status activity for the selected PHY.
12
Dropdown menus to load a script file. These two dropdown menus allow the user to load a script file with a sequence of write
commands to load to the device.
21
419
-013
Figure 12. Main GUI Window


