User Guide
ACE SOFTWARE OPERATION
Rev. A | 16 of 30
WAVEFORM TAB
The
Waveform
tab displays data in form of time vs. discrete data
values with the results, as shown in
.
The
Waveform
graph shows each successive sample of the µMod-
ule output. The user can zoom in on and pan over the
Waveform
graph using the embedded waveform tools above the graph. Select
the channels to display in the
Display Channels
section.
Under the
Display Units
pulldown menu, select
Codes
above the
Waveform
graph to select whether the
Waveform
graph displays in
units of
Codes
,
Hex
, or
Volts
. The axis controls are dynamic.
When either
y-scale dynamic
or
x-scale dynamic
is selected, the
corresponding axis width automatically adjusts to show the entire
range of the µModule results after each batch of samples.
HISTOGRAM TAB
The
Histogram
tab contains the histogram graph and the
RE-
SULTS
.
The
RESULTS
pane displays the information related to the dc
performance.
The
Histogram
graph displays the number of hits per code within
the sampled data. This graph is useful for dc analysis and indicates
the noise performance of the device.
FFT TAB
The
FFT
tab displays fast Fourier transform (FFT) information for
the last batch of samples gathered (see
When performing an FFT analysis, the
RESULTS
pane shows
the
Noise
and
Distortion
SNR
and other noise performance measurements,
such as
SINAD
,
Dynamic Range
, noise density (
Noise / Hz
), and
SFDR
, are shown in the
Performance
section. The
THD
measure-
ments, as well as the major harmonics contributing to the THD
performance, are shown in the
Distortion
section.
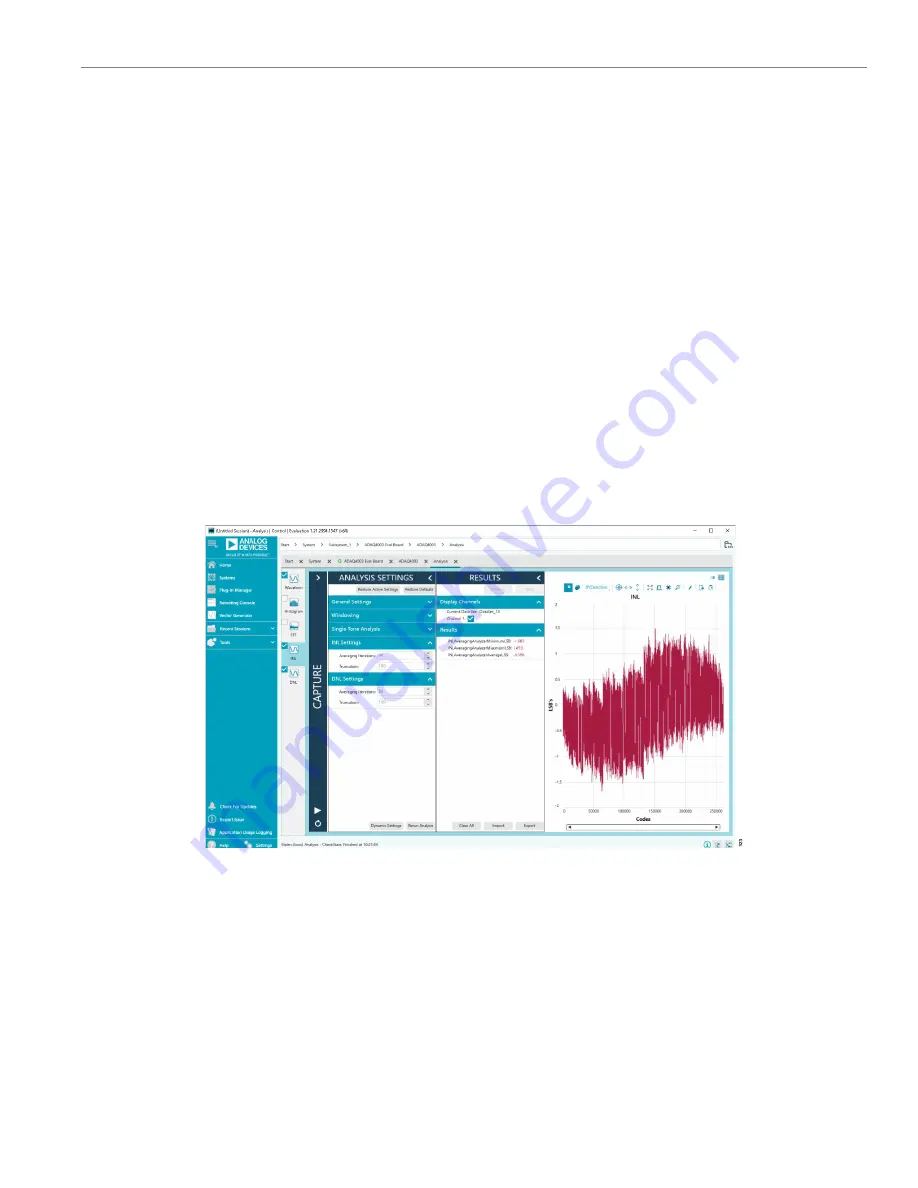
INL AND DNL TAB
The
INL
DNL
the linearity analysis. To perform a linearity test, apply a sinusoidal
signal with 0.5 dB full scale to the
or
Figure 23. INL Tab


