Specifications
27
Prosilica GC Technical Manual V2.2.0
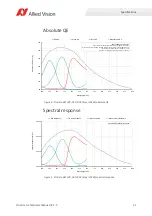
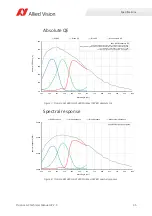
Absolute QE
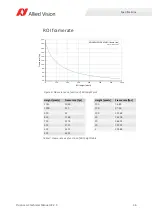
Spectral response
Figure 1: Prosilica GC660, GC660C (Sony ICX618) absolute QE
Figure 2: Prosilica GC660, GC660C (Sony ICX618) spectral response
0%
10%
20%
30%
40%
50%
60%
70%
80%
90%
400
450
500
550
600
650
700
750
800
850
900
950
1000
Quan
tum
E
fficiency
[%]
Wavelength
[nm]
Sony
ICX618
absolute
QE
All
measurements
were
done
without
protection
glass
or
IR
cut
filter.
With
protection
glass
or
filters,
quantum
efficiency
(QE)
decreases
by
approximately
10%.
The
uncertainty
in
measurement
of
the
QE
is
+/
Ͳ
10%.
The
values
are
typical
and
are
subject
to
minor
variations.
Red
QE
Green
QE
Blue
QE
Monochrome
QE
0.0000
0.1000
0.2000
0.3000
0.4000
400
450
500
550
600
650
700
750
800
850
900
950
1000
Spectr
al
Re
sp
o
n
se
[A/W]
Wavelength
[nm]
Sony
ICX618
spectral
response
Red
Response
Green
Response
Blue
Response
Monochrome
QE

