background image

AirTest PT9250 & CO

2

 Application Guide

7 of 

12

5. Data Logging With The PT9250

Overview

The  ability  to  record  CO

2

  and  temperature  data

over time and graph it is a powerful analytical tool
that  can  help  you  better  understand  how  a
building is operated.

When  assessing  a  building’s  ventilation  rates
often  the  first  step  is  to  do  a  spot  measurement
as  described  in  chapter  3.   If  unusually  high  or
low levels are detected, the next logical step is to
verify  the  reading  by  measuring  concentrations
over time and graphing the results.

When  assessing  ventilation  rates,  the  graphed
peak  CO

2

  concentration  becomes  readily

apparent  for  estimating  ventilation  rates.   And  if
concentrations  are  measured  over  a  number  of
days,  consistency  patterns  of  occupancy  and
ventilation can be verified.

Application Tips For Data Logging

Note  End  Of  Logging  Period:

   In  order  to

properly time stamp data, make note of the time
you turn off the sensor after the logging session.
You  will  be  asked  for  this  data  when  exporting
the data to a text file.

Managing Data:

  If  possible,  it  is  recommended

that you download logged data to a text file soon
after completing a measurement.   Once the data
has been exported, reset the data logger to erase
the  memory.   This  will  make  it  much  easier  to
manage  files  on  the  data  logger  and  will  ensure
that  old  data  will  not  be  erased  if  all  895  data
points are used.

Setting  Logging  Interval  To  Desired
Measurement  Time  Period:

   To ensure you do

not  exceed  the  database  memory  (895  points)

and  write  over  previously  recorded  data,  a
sampling  interval  should  be  selected  that  allows
for  adequate  space  in  the  data  logger.   Some
guidelines  on  maximum  sampling  periods  are
provided below.


1 Day – 2 minute sampling


2 Day – 4 minute sampling


5 Day – 10 minute sampling


7 Day – 15 minute sampling

Battery  Life  &  Logging:


The battery life of the

PT9250 is 10 to 16 hours.   As a rule you should
have  the  PT9250  plugged  into  it’s  charger
whenever  you  are  logging  concentrations  for
extended periods of time.

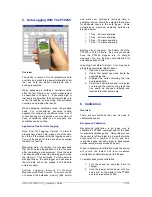
Graphing Text Data In Excel:

  It is very easy to

graph the exported text files in Excel.

1.  Open the Excel® program.
2.  Under  ‘file’,  select  open  and  locate  the

exported text file.

3.  Highlight  the  cells  containing  the  time

and reading data.

4.  Select the chart wizard and it will guide

you through the creation of a graph that
can  easily  be  changed,  labeled  and
inserted into other documents,

6. Calibration

Overview

There  are  two  methods  that  can  be  used  to
calibrate the sensor.

Background Calibration

Background  calibration  is  an  easy  way  to
calibrate the PT9250 overnight without the need
for special calibration gases.   Using this process,
the sensor is left overnight in an area that will be
unoccupied  for  a  number  of  hours,  and  as  a
result  the  space  will  likely  drop  to  background
outside levels (always around 400 ppm).

When in background calibration mode the sensor
will  record  the  lowest  CO

2

  level  measured

overnight and calibrate this point to 400 ppm.

To activate background calibration:

1.  Turn  the  sensor  on  and  plug  it  into  its

charger.

2.  Hold  the  power  button  down  until  you

see “cal b” on the display of the PT9250
and then release the button.

Содержание PT9250

Страница 1: ...help you understand buildings better in order to save energy and solve problems Its one thing to measure CO2 however this book provides a study guide that will quickly give you the critical knowledge and a competitive advantage in using CO2 as a powerful and profitable measurement parameter of ventilation and building performance Table Of Contents 1 Introduction 2 2 Quick Start Basics 2 3 Spot Che...

Страница 2: ...Start Basics Turning On The Hand Held Sensor Plug the charger provided with the sensor into the bottom of the TR9250 and allow it to charge for at least 1 5 hours To power up the TR9250 you will have to hold the power button down for approximately 10 seconds while the sensor performs a self diagnostic check Once you press the power button you will see 88 88 displayed on the upper display and 88 88...

Страница 3: ... space By using the pC program provided with the sensor you can change both the location and the way this information is displayed on the screen 3 Spot Check Ventilation Rates Background The PT9250 not only measures CO2 and Temperature but it also calculates the outside air ventilation rate in cfm per person based on the difference between inside and outside CO2 levels So how can we determine the ...

Страница 4: ... or windows as well as the area directly surrounding a discharge grill Blowing Into The Sensor Pure exhaled breath contains 40 000 ppm of CO2 that will readily disperse in air Try to avoid breathing directly on the sensor when taking a measurement If you do breath into the sensor it will not hurt the sensor but it may take a few minutes for the sensor to readjust to normal background levels Since ...

Страница 5: ...verter attachment that will allow the cable provided to interface with a USB port When you start the program it will immediately search for the sensor plugged into your computer and start to download information in the sensor This may take a few minutes If you are having problems with connecting to the sensor visit the troubleshooting section of this document General Tab Once the program has loade...

Страница 6: ...connected from the PT9250 Graphed Results Each time the sensor is turned on a new logger file is created and can be identified at the top of the graphical display By clicking on the file you can view the set of data for that file The oldest files will have the lowest number Once the data logger has reached its maximum capacity it will begin logging over the oldest data The graph function is very b...

Страница 7: ...e database memory 895 points and write over previously recorded data a sampling interval should be selected that allows for adequate space in the data logger Some guidelines on maximum sampling periods are provided below 1 Day 2 minute sampling 2 Day 4 minute sampling 5 Day 10 minute sampling 7 Day 15 minute sampling Battery Life Logging The battery life of the PT9250 is 10 to 16 hours As a rule y...

Страница 8: ...f the PT9250 is on the zero adjustment of the sensor The sensor generally should not require span adjustment If performing both types of calibration the zero calibration should be performed first 7 Making Most Of The TR9250 Some Application Examples Overview This section provides a brief description of a number of real world applications for the PT9250 hand held Estimating Ventilation Rate From A ...

Страница 9: ...essed in the decimal equivalent of parts per million Vop 0 0106 0 000675 0 000400 3 8 5 cfm person If the number of people in the space is known when the measurement is taken the total outside air ventilation rate to the space can be calculated by multiplying the occupancy times the number of people in the space This value in most buildings will represent the fixed ventilation rate provided to the...

Страница 10: ...ow quickly levels change when you open a window or a door Dealing With IAQ Complaints Many symptoms related to indoor air quality IAQ complaints can also be associated with other physical ailments stress or emotional issues related to the individual If you are involved in investigating a suspect IAQ problem you can use the PT9250 to determine if ventilation is a factor in the complaint or concern ...

Страница 11: ... a ceiling return plenum may reflect excessive supply air duct leakage into the plenum Calculation of percentage of outside air in an air handler can be performed using a process identical to the differential temperature method except substituting CO2 levels measured Determine if ventilation systems are delivering adequate fresh air to a particular zone based on its current occupancy Improperly ad...

Страница 12: ...al CO2 retrofit you may also want to include use of Variable Speed Drives to modulate air delivery Ideally the system should be integrated with the existing building control system Most major control manufacturers have CO2 control routines available thatwill run with their systems Further Application Reference AirTest has numerous articles and application notes available on CO2 control systems and...

Отзывы: