23
3
Viewing Health Data
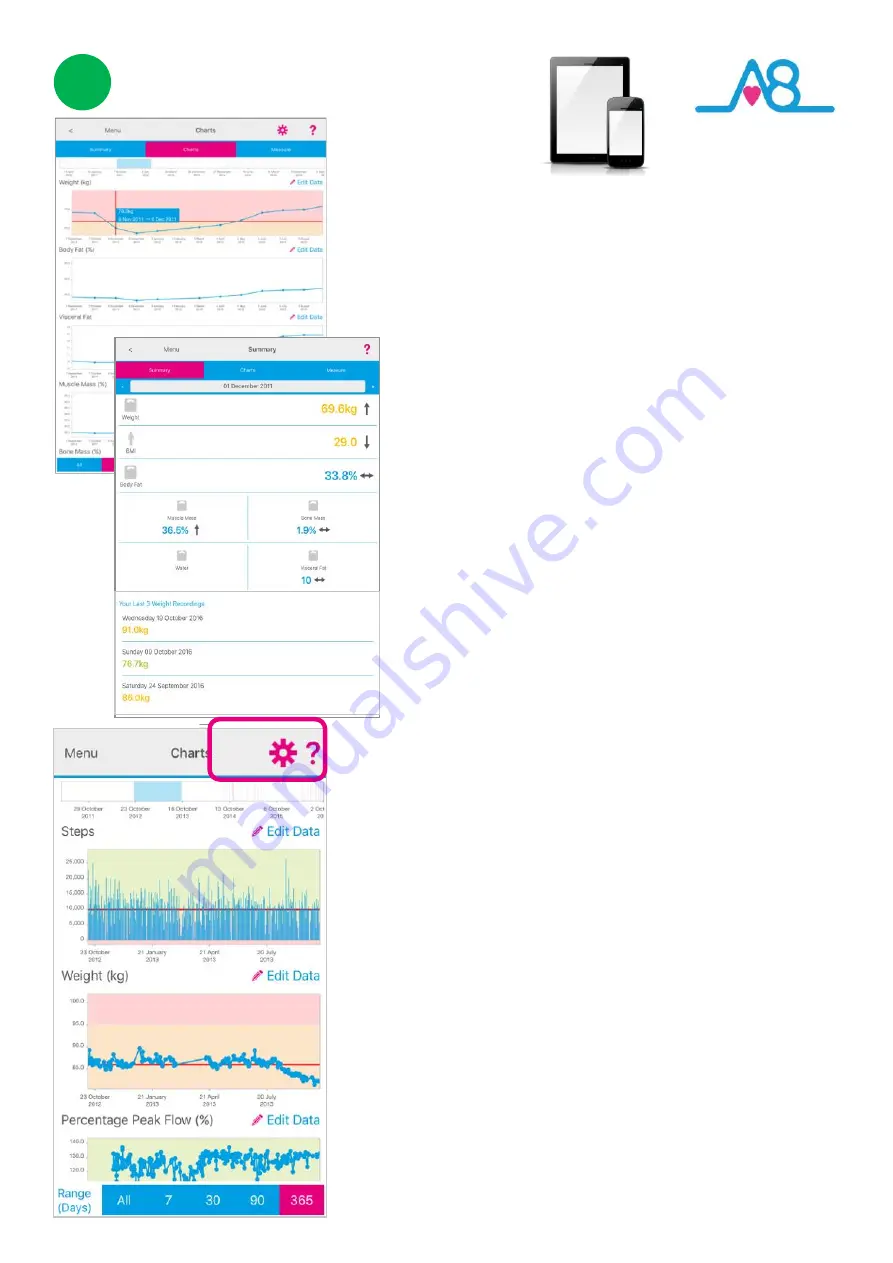
Detailed data can be viewed from the
Activ8rlives
Health Data
by selecting
Health Data
from the
Menu.
The reading from the
Activ8rlives
Body Analyser
will display the
weight on the scales LCD Display. The
Activ8rlives
4
Wellness App
displays a more comprehensive set of
measurements.
You will also see your previous 3 readings.
Your data can be shown in
Charts
mode and scroll down the
page to see other parameters of your health, such as your BMI,
Lung function, wellness or stress levels or anything else you
would like to record about your health and wellbeing.
When looking at your data, a
Trackball
function allows you to
touch a bar chart or data point for a specific date and it will give
the reading and its date. You can scroll left or right to look at
your data.
By selecting or deselecting the
Settings Cog
i
n the top right
-
hand corner you can choose which data you want to show.
You can display over different timeframes, by changing the time
from the bottom
Range Days:
7
, 30, 90, 365 days or All data.
When you are in the
Charts
view you can change the
Data View
for how you would like your data to be displayed. Play around
with your settings to optimise the
Charts
for you.
Colour coding
of parameters within normal
Green
, alert
Amber
and out of parameter
Red
readings are easily seen on these
Charts
where the background colour indicates the population
normal ranges as described on
Pages 8
-
11
.
Within this section you can start to see trends of what affects
your other health parameters, and you begin to learn healthy
behaviours or detect declining health.
Содержание Body Analaser
Страница 32: ...32 ASL TF 006 MAN06 Body Analyser V3 0 ...


