


USER MANUAL
Solar DataSnap | Sep. 30, 2021 © 2021 Acclima, Inc. https://acclima.com
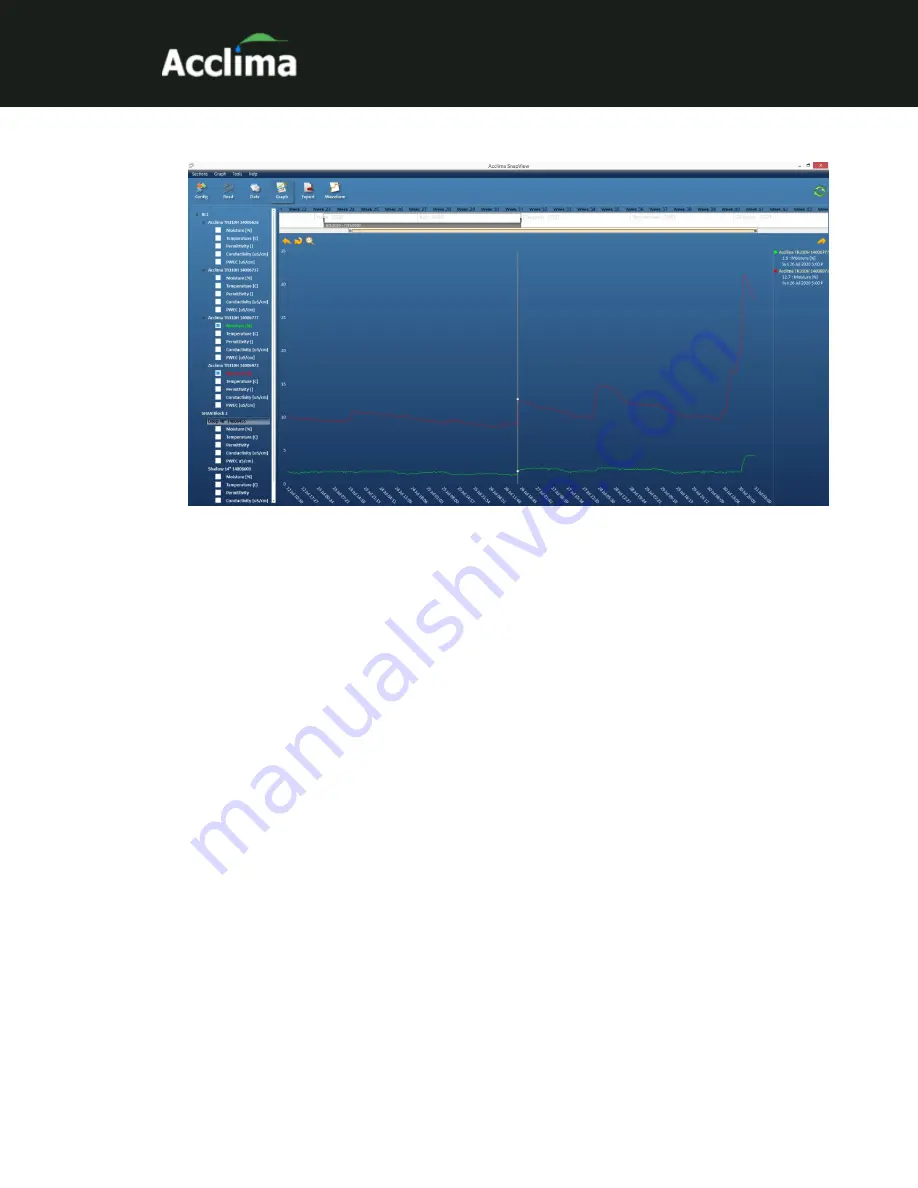
Figure 15 – Data in Graph View
The Graph view has 3 main sections.
•
Sensor Reading list – list of sensors and their individual readings
•
Time bar – provides an easy way to specify date ranges in the main
graph
•
Main graph – displays the selected sensor readings in the specified
date range.
Graphing Sensor Data
•
Click the ‘Graph’ button at the top of the screen.
•
Select one or more sensor readings
– Each DataSnap is
displayed in a tree at the left of the screen. Clicking a DataSnap
reveals its list of sensors. Clicking a sensor reveals its available
readings. Click the checkbox to the left of each desired reading to
display its data on the graph. A maximum of 14 readings can be
shown on the graph. To widen the sensor list, hover the cursor over
the vertical border between the sensor list and the main graph. The
cursor will change to a horizontal arrow. Click the left mouse and
while holding down the left mouse button, drag to the right.
•
Specify the date range
- The time bar at the top of the screen
shows a range of selectable dates. See figure 16.


