25
7
Appendix
7.1
Software - Chart Design Elements
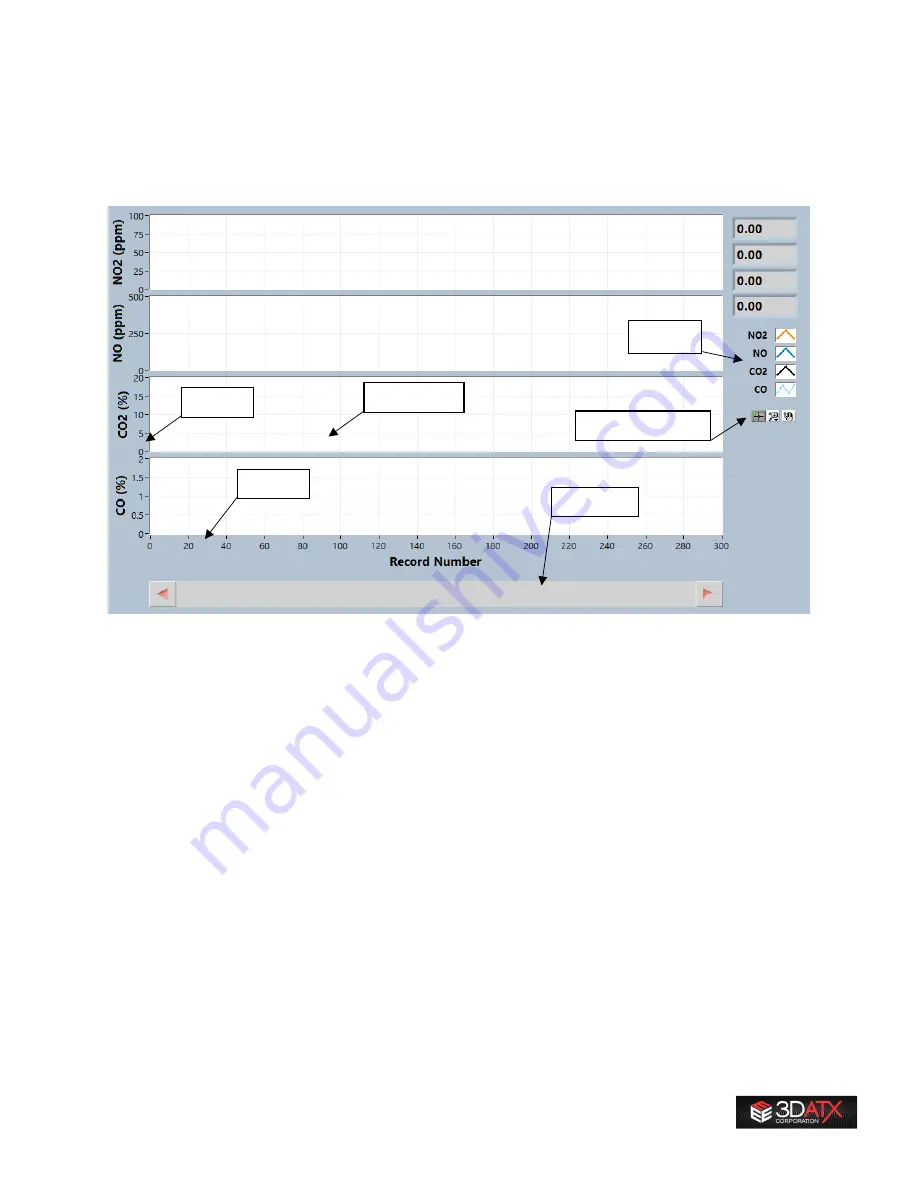
This section covers the common design elements in parSYNC® user-interface charts.
7.1.1
Y-axis and X-axis
Place your mouse on either the Y-axis (vertical axis) or the X-Axis (horizontal axis) and right-click to see
options to change marker space and turn autoscale ON/OFF. The autoscale function is particularly useful
for the Y-axis. In this example, the NO
2
(ppm) scale is set to 0-100 ppm. If autoscale is OFF, the scale
stays fixed, so if your signal is 2 ppm, it might not be easily visible, or if it jumps to 150 ppm, it is too high
to be displayed. If autoscale is ON, the Y-axis will change dynamically so that it is zoomed in tightly on
the range of displayed values. So, if your NO
2
was between 2 and 45 ppm, the Y-axis might become 0-50
ppm automatically. If the next value is 62 ppm, the Y-axis might change to 0-65 ppm. There are times
when you want to turn OFF the autoscale, for example when measuring ambient or a signal that is going
to vary a bit, but is overall tightly bound. For example, if the measurement is within 2-6 ppm, it is best to
set the scale to 0-10 ppm and turn OFF autoscale so the graph appears more “stable”. If the graph’s Y-
axis is scaling rapidly, turn OFF the autoscale feature. All of this is also true for the X-axis, but since that’s
always time, there aren’t any rapid scaling issues.
X-Axis
Y-Axis
Legend
Control Palette
Scroll Bar
Chart Area
Содержание parSYNC
Страница 1: ...User Guide 3DATX Corp parSYNC miniPEMS Updated July 2020 ...
Страница 21: ...21 ...
Страница 38: ...38 ...


