4
6. Operation
6.1 Moving the pendulum rod
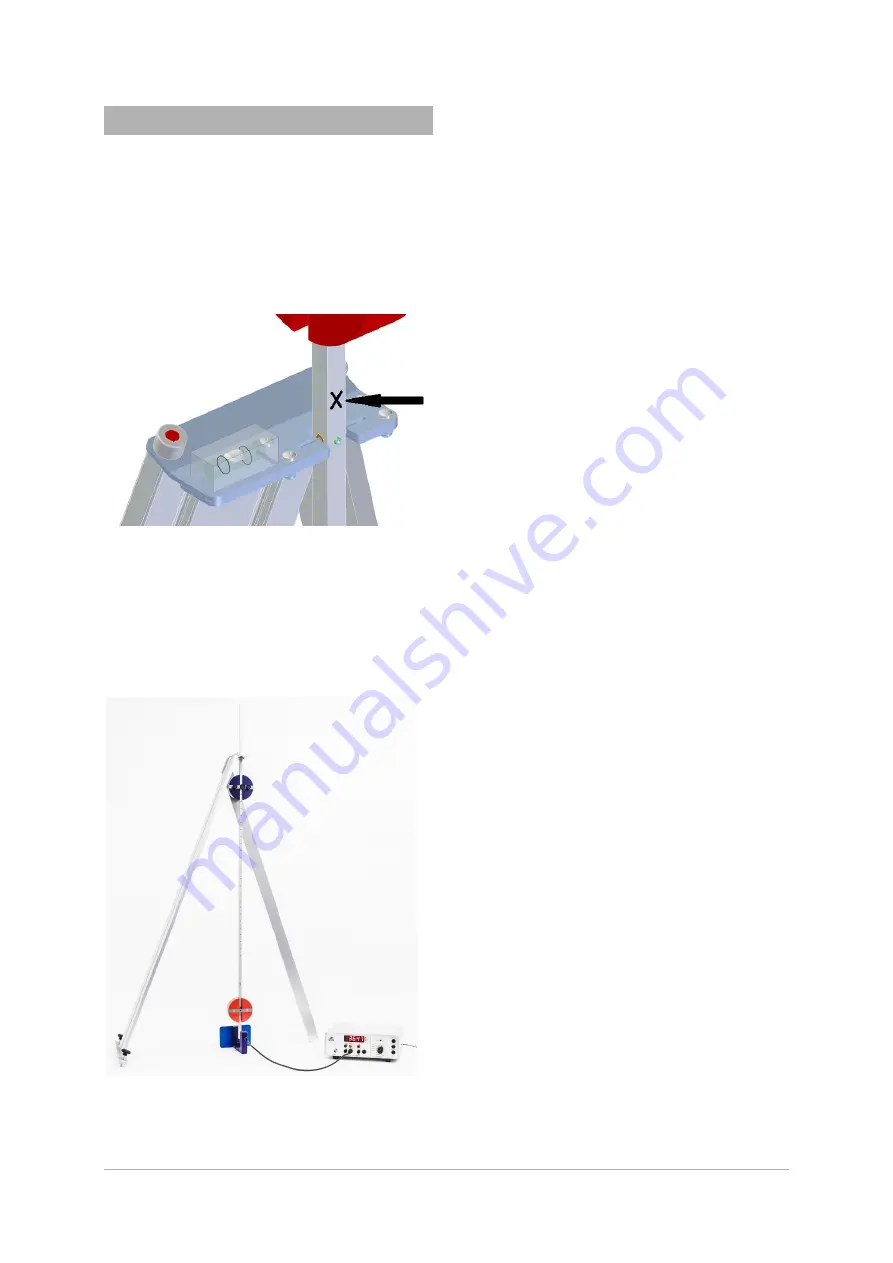
Use gentle pressure to move the pendulum in
the direction of the arrow with several pushes
at the position marked until the deflection is
about 5 cm.
Note:
Larger deflections can lead to non-negligi-
ble measurement errors.
Fig. 4: Moving the pendulum rod
6.2 Reversing the pendulum position
Use both hands to lift the pendulum out of the
bearing plate and turn it around.
Carefully suspend the pendulum from the
bearing plate by its other fulcrum. Then carry
on as in step 6.1.
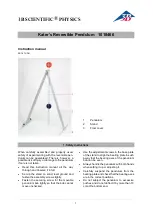
Fig. 5: Experiment set-up with light barrier and digital
counter
6.3 Period of oscillation depending on the posi-
tion of the movable pendulum bob
Additionally required:
1 Light barrier
1000563
1 Digital counter (@230 V)
1001033
or
1 Digital counter (@115 V)
1001032
Set up the light barrier under the pendulum
rod while it is stationary and connect the bar-
rier to the digital counter (see Fig. 5).
Suspend the pendulum rod from the bearing
plate in such a way that both the fixed bob
(red) and the movable bob (blue) are below
their corresponding fulcra.
Attach the movable bob in the wedge-shaped
groove nearest to the fixed bob, i.e. the low-
est one. This position will subsequently be re-
ferred to as measuring point 1 (even when
the pendulum rod is suspended above the
other fulcrum).
Measure the period of oscillation and make a
note of it..
Keep moving the movable bob from one
groove to the next and secure it (measuring
points 2
– 13). In each case, measure the pe-
riod of oscillation and make a note of it.
Now suspend the pendulum rod from the
bearing plate in such a way that the fixed pen-
dulum bob (red) is above the relevant fulcrum
and the movable bob (blue) is below its bear-
ing.
Secure the movable pendulum bob in the
wedge-shaped groove nearest to the fixed
bob, i.e. the highest one. This position will
subsequently be referred to as measuring
point 1 (see above).
Measure the period of oscillation and make a
note of it.
Keep moving the movable bob from one
groove to the next and secure it (measuring
points 2
– 13). In each case, measure the pe-
riod of oscillation and make a note of it.
Plot a graph of the periods of oscillation de-
termined in both sets of measurements as a
function of the numbers
n
of the measure-
ments (see Fig. 6).


