R&S RTE, Getting Started
Looking for an Instruction Manual for your Movement RTE product? Look no further! Download the comprehensive manual for free from our website and unleash the full potential of your device. Clear, concise, and user-friendly, our manual guarantees a seamless experience. Visit manualshive.com now and get your hands on it!
Share
Download


Reviews:
No comments
Related manuals for RTE

D-IMager EKL3104
Brand: Panasonic Pages: 13
7200
Brand: Labokey Pages: 5

550
Brand: E-Z Trail Pages: 8

600
Brand: B&K Pages: 10
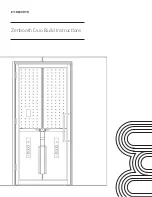
Duo
Brand: Zenbooth Pages: 60
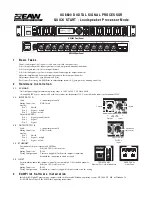
UX8800
Brand: EAW Pages: 2

907
Brand: abc Pages: 28

358
Brand: Taylor Pages: 60

Model 5
Brand: TANDBERG Pages: 23

4431
Brand: Backyard Play Systems Pages: 73

MegaCode Kelly
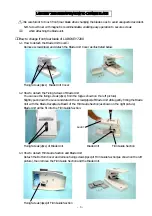
Brand: laerdal Pages: 8

46018
Brand: LAHTI PRO Pages: 16

LSU
Brand: laerdal Pages: 32

Resusci Anne
Brand: laerdal Pages: 32

ALS Simulator
Brand: laerdal Pages: 8

VARIO2 series
Brand: Raytec Pages: 60

Konnekt 24D
Brand: TC Electronic Pages: 67

SS-CDR1
Brand: Tascam Pages: 3


