


SonTek/YSI Inc
RiverSurveyor System Manual (May 1, 2007)
99
A
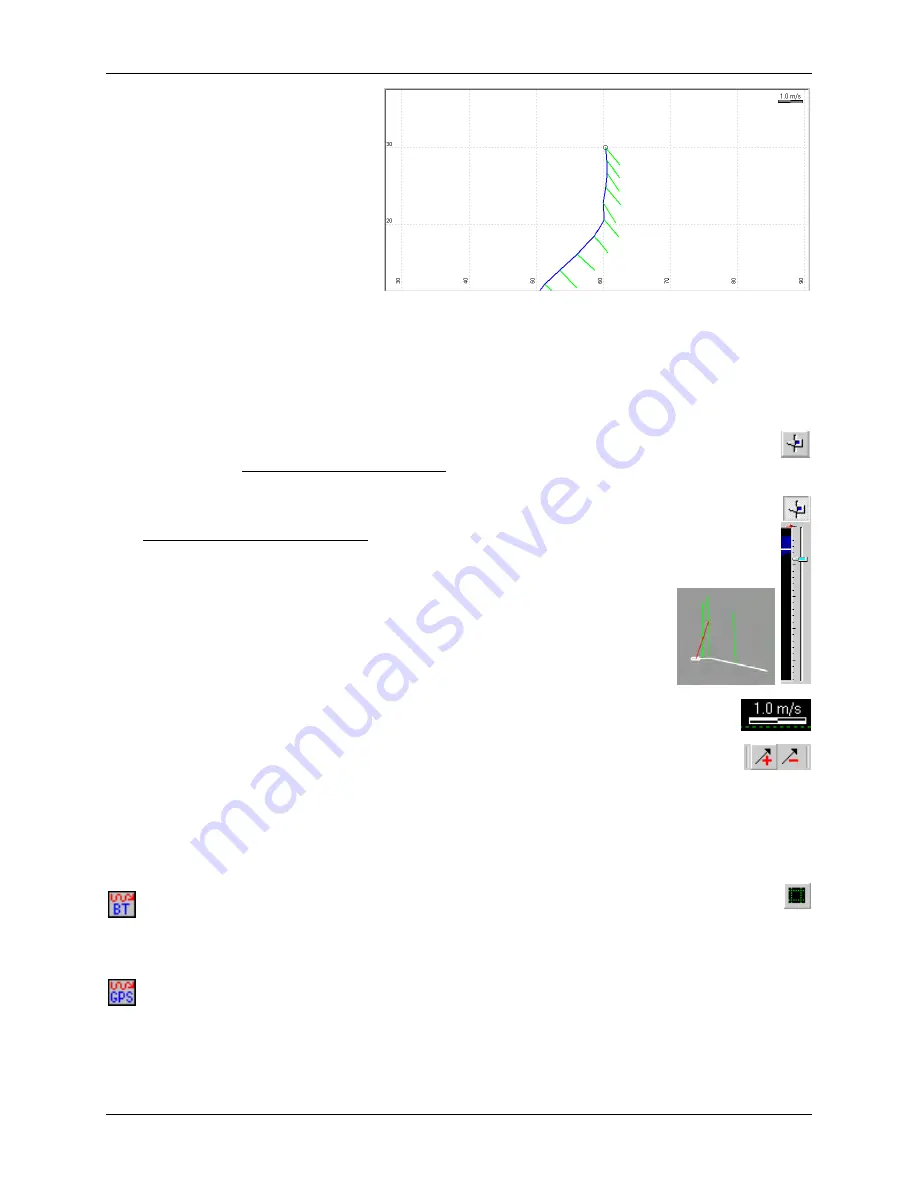
current vector
(usually a green
line) is displayed for each profile,
orientated in the direction of the
measured flow. The length of the
vector is proportional to the magni-
tude of the water current speed. Vec-
tor length can be scaled using the
In-
crease
or
Decrease Vector Length
toolbar icon.
The
Track Window
in
shows a vessel traveling to the north-
east and then to the north. A total of ten profiles have been collected so far, each with a fairly
regular current speed and direction. The currents are moving to the southeast. The total distance
traveled, or track length, is just over 20 meters.
Regarding the current vector “sticks”:
•
They are normally displayed in
green
to show the averaged water current magnitude
and direction for the entire vertical profile. This condition is active when the
User
Selected Depth Cell/Depth Averaged
button is “raised”.
•
When the sticks are
light blue
, they show water current magnitude and direction just
for the selected depth cell layer. To select this condition, click the
User Selected Depth
Cell/Depth Averaged
button to “depress” it. You must also select the desired layer by
moving the slide control next to the
Contour Display
to the appropriate depth.
•
If bottom-track is lost for a profile, the stick will be
red
(as will the
BTRACK
indicator light on the status bar). The figure to the right shows
a
Track Window
example where the last profile has lost bottom-track
(the stick is red and points to the northeast). The other three profiles
show valid bottom-track data (the sticks are green and point north).
•
Each stick shows the direction to which the water is moving. The length of the
line is based on the magnitude of the speed referenced to the vector legend in the
top right of the
Track Window
. The legend is a fixed value, but you can adjust the
scale of the legend (and the sticks) by clicking the
Increase/Decrease Vector
Length
buttons (or by pressing the
+
or
–
keys on the computer’s numeric keypad).
The
Track Window
has an underlying grid that serves as a rough “distance” indicator. The grid is
shown as dashed horizontal and vertical green lines. The grid changes depending on the track
reference selected (§
).
•
Bottom-Track
– The grid lines are spaced equally (default is 20 m). Clicking the
Modify
Grid Spacing
button opens a dialog box that lets you change the grid size. If the grid spacing
is set to
Enable Automatic Grid Spacing
(in
File|Configuration|Track Display
), the program
automatically spaces the grid based on the total display area.
•
GPS
– The grid is displayed as latitude and longitude. Each of the grid lines is labeled with a
latitude (horizontal lines) or longitude (vertical lines) in degrees, minutes, and seconds.
The
Track Window
automatically repositions the vessel track to best show the vessel’s present
position. You can do this manually using the cursor control keys (up, down, left, right) or by us-
ing the scroll wheel on the mouse (vertical scrolling only).
Figure 7-10. Track Window Example #1
Summary of Contents for SonTek RiverSurveyor
Page 2: ...SonTek YSI Inc RiverSurveyor System Manual May 1 2007 ii ...
Page 4: ...SonTek YSI Inc RiverSurveyor System Manual May 1 2007 iv ...
Page 14: ......
Page 24: ...SonTek YSI Inc RiverSurveyor System Manual May 1 2007 12 ...
Page 26: ...SonTek YSI Inc RiverSurveyor System Manual May 1 2007 14 ...
Page 74: ...SonTek YSI Inc RiverSurveyor System Manual May 1 2007 62 ...
Page 82: ...SonTek YSI Inc RiverSurveyor System Manual May 1 2007 70 ...
Page 148: ...SonTek YSI Inc RiverSurveyor System Manual May 1 2007 136 ...
Page 162: ...SonTek YSI Inc RiverSurveyor System Manual May 1 2007 150 ...
Page 166: ...SonTek YSI Inc RiverSurveyor System Manual May 1 2007 154 ...
Page 168: ...SonTek YSI Inc RiverSurveyor System Manual May 1 2007 156 ...
Page 182: ...SonTek YSI Inc RiverSurveyor System Manual May 1 2007 170 ...
Page 194: ...SonTek YSI Inc RiverSurveyor System Manual May 1 2007 182 ...


