background image

1-5 Auto 

Search 

‹

  Setting Up the Analysis Conditions 

c

  Display the waveform you want to analyze. 

(You cannot set up the conditions without any 
waveform displayed on the screen.) 

d

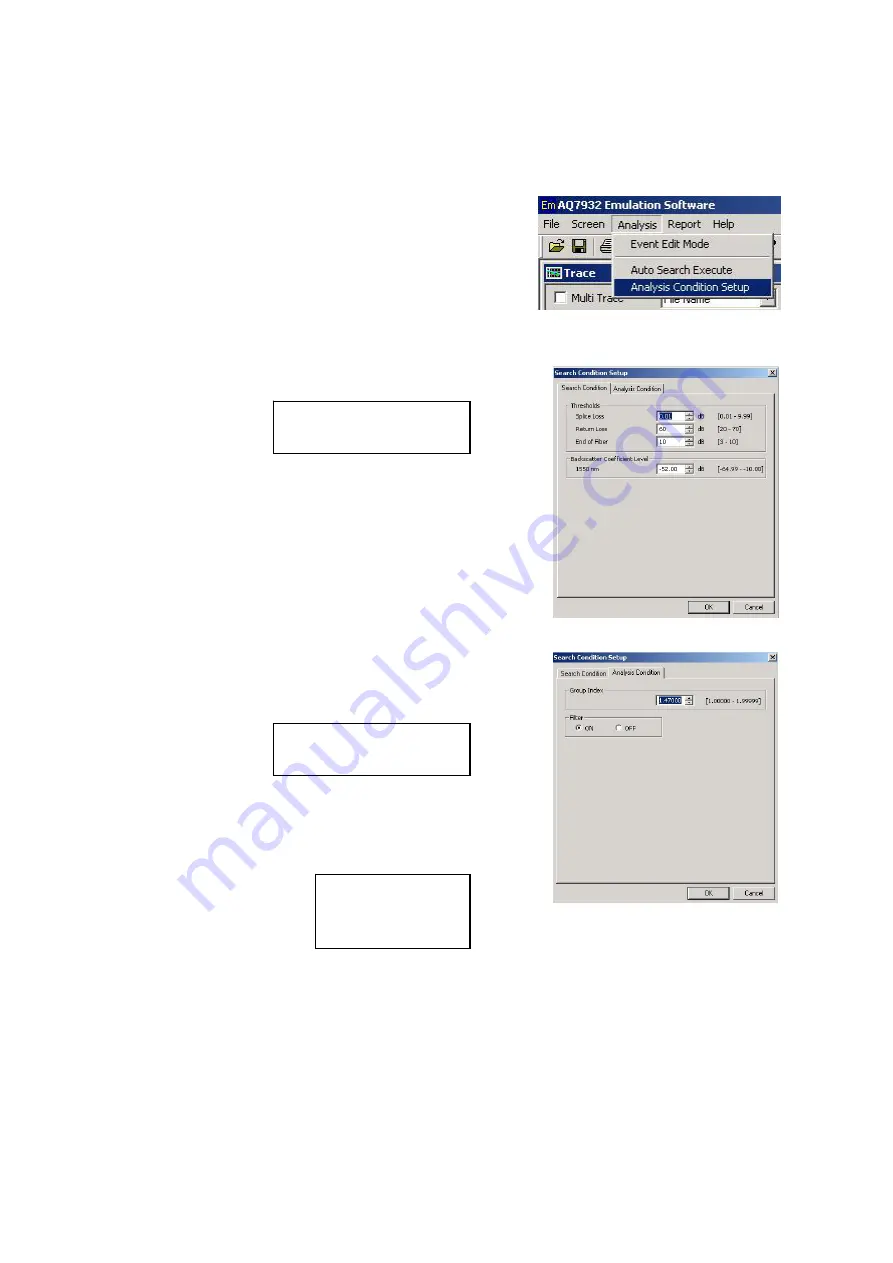
  Click [Analysis] in the menu. 

e

  Click [Analysis Condition Setup]. 


f

  Set up the threshold values (Splice Loss, Return Loss, and End of Fiber). 


See the help facilities. 

 Analysis Menu 

 Analysis Condition Setup 


g

  Click the tab of [Analysis Condition]. 


See the help facilities. 

 Analysis Menu 

 Analysis Condition Setup 


h

  Set up the Group Index. 

i

  Set the filter to ON or OFF. 


See the help facilities.

 Terminology List 

 Group Index 

 Filter 


8

Summary of Contents for AQ7932

Page 1: ...User s Manual Y okogawa Electric Corporation Model 735070 AQ7932 OTDR Emulation Software Operation Manual IM 735070 05E 1st Edition...

Page 2: ...icrosoft Windows XP Excel Microsoft Excel 2000 or later When the XLS file output function is used PC Clock speed An environment where the OS comfortably operates Capacity of the HDD At least a free ha...

Page 3: ...s 2Way Trace Mode 6 1 5 Auto Search 8 1 6 Printing 10 Chapter 2 Editing and Saving Data 11 2 1 Changing the Group Index and Inserting Comments on a Section Basis 11 2 2 Label Batch Conversion 12 2 3 S...

Page 4: ...ile you want to display The label measurement conditions and the overall view of the selected file will be displayed h Click Open The waveform will be displayed on the trace screen If you want to disp...

Page 5: ...o display only the current waveform or all the waveforms on the trace screen Mark the Multi Trace checkbox If a checkmark is placed you can display two or more number of waveforms on the trace screen...

Page 6: ...e three default values provided for black white and gray backgrounds respectively The default trace colors are preset which are suitable for each background Furthermore selecting User Setup allows you...

Page 7: ...rsor appears at the position of the pointer d Click and drag the cursor at the position where you want to display the marker Moving the cursor e Click the button Setting up the marker n In the same ma...

Page 8: ...click the mouse and the cursor moves to the center of the marker e Release the left button at the position to which you want to move the marker The marker n is set Operation with a Marker Button c Mov...

Page 9: ...Analysis Loading the Waveform File To Be Used as the Reference f Click File Select in the Reference File area g Select the folder storing the waveform file you want to display h Select the file type...

Page 10: ...Select in the Original Direction File area The succeeding steps are the same as those for the differential waveform described on the previous page See them Loading the Reverse direction Waveform Data...

Page 11: ...he menu e Click Analysis Condition Setup f Set up the threshold values Splice Loss Return Loss and End of Fiber See the help facilities Analysis Menu Analysis Condition Setup g Click the tab of Analys...

Page 12: ...to the number of the event on the trace waveform you want to delete and click it Otherwise click the desired event number in the event list d Click the button Moving an Event c In the event list click...

Page 13: ...checkbox of the item you want to print out f Click OK If you want to print out a screen with two or more number of waveforms select Multi Trace Margin Setup is also available g Click Print Preview fro...

Page 14: ...to change in the event list Sample Display Changing the group index of the fiber between the event numbers 2 and 3 Right click here d Click Change Group Index e Click OK after changing the value See...

Page 15: ...ck File in the menu d Click Label in Batch Conversion Selecting Files and Converting Their Labels Individually e Click Select Files as individually f Click File Select Selecting the Files of Which the...

Page 16: ...Folder and File Type f Click Folder Select g Specify the folder storing the waveform files of which the labels you want to convert h Select the file type Select the file format of the waveform file i...

Page 17: ...d Click File Type in Batch Conversion Selecting Files and Converting Their Formats Individually e Click Select Files as individually f Click File Select g Select the files of which the file format yo...

Page 18: ...les you want to convert g Click Folder Select h Specify the folder storing the waveform files you want to convert i Click Next Now the files you want to convert have been loaded j Click Next k Click F...

Page 19: ...table of the measured values Sample Trace Output Sample Total Table Output Proceed with the operation along the steps of the report wizard You can return to the previous step any time when you want to...

Page 20: ...Page Layout c Fill the desired item fields as necessary Up to 50 characters You can change the title and the item names Direct entry for the title selection from the pull down menu for the item names...

Page 21: ...of cores and the start core No d Select the file format same as that of the waveform files e Click File Select f Click Folder Select g Select the folder storing the waveform data you want to load Amo...

Page 22: ...on from Auto Search Set up Search Condition and or Analysis Condition as necessary e Click OK See the help facilities Trace Output Step 5 Auto Generation f If a measurement is made bidirectionally the...

Page 23: ...inting screen will appear d Click Print Printing will be performed You can perform enlargement of the screen display or other operations using other icons e Click Excel The waveform will be output as...

Page 24: ...tem s to be displayed e Click Next Step 2 Layout Options Page Layout c Fill the desired item fields as necessary Up to 50 characters You can change the title and the item names Direct entry for the ti...

Page 25: ...summarized e Click File Select f Click Folder Select g Select the folder storing the waveform data you want to load Among the files in the folder the files of the format specified in Step d above are...

Page 26: ...n Setup window will appear Select G d eneration from Auto Search is Condition as e f a measurement is made bidirectionally the master events orm Steps c g lick Total Loss Marker Edit box of add a Tota...

Page 27: ...6 Output Setup c Click Preview d Click Print Printing will be performed You can zoom into the screen display using Zoom In e Click CSV Sample CSV Output Display f Click Excel Sample Excel Output Displ...

Page 28: ...otal Table Edit See the help facilities Total Table Output Step 6 Total Table Edit d Click Connection Type Setup Set up the connection type name splice connector n c of the event and these standard va...

Page 29: ...umber of waveforms are displayed it is difficult to distinguish each waveform because they are overlapping one another Change the waveform offset display value at the upper left of the trace screen by...

Reviews: