27
NOTE:
Auto-switch-off of the instrument is disabled, if data is being recorded with the automatic Data
Logger mode
IMPORTANT
: The correct and systematic use of parameters P9.3 / P9.4 / P9.5 / P9.9 allows to significantly
lengthen battery life.
D Software
(per Windows 7/8/XP/10)
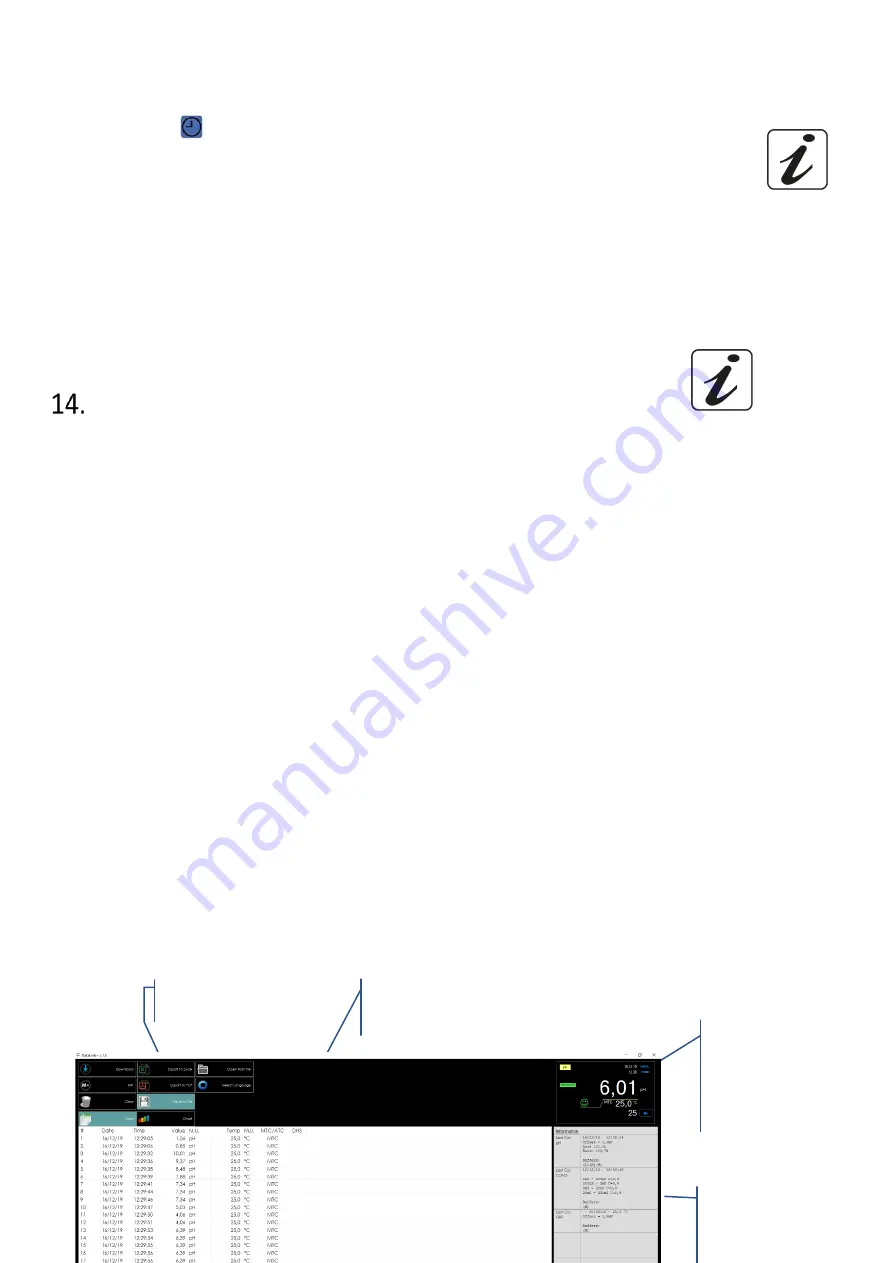
It is possible to connect the instruments of the 70 Vio series to the PC and then use the Da 1.6
software (and later versions) to perform data download, Data Logger directly on PC and exports in .xls (Excel)
and .pdf.
The software can be downloaded for free from the web site (pay attention to the correct installation of the
drivers).
•
https://www.giorgiobormac.com/it/download-software_Download.htm.
•
Connect the USB cable inside each package to the USB port on the top panel of the instrument and the
other end to a COM port on the computer.
•
Use the USB cable supplied with the instrument only.
•
Start the program and then switch on the instrument.
•
Wait for connection to be established (the connection data are shown at the bottom left of the display).
•
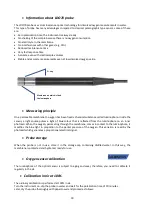
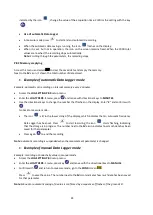
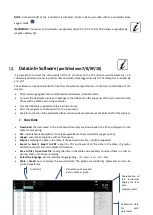
Functions
•
Download
: the data saved in the instrumental memory are downloaded to a PC and displayed in the
table for processing.
•
M+
: instantaneous acquisition of a value (equivalent to the manual Data Logger option).
•
Logger
: automatic acquisition with set frequency.
•
Empty
: emptying the data in the table. If the password is active, it will be requested.
•
Export to Excel / Export to PDF
: export to PDF and Excel of all the data in the table, of graphs,
calibration reports and instrumental information.
•
Save to file / Open from file
: saving the data in the table and possibility to reload them in order to
process them or continue recording.
•
Select the language
: set the interface language (Eng – Ita – Deu – Esp – Fra – Cze).
•
Table
/
Graph
: how to display the acquired data. The graphs are divided by parameter and can be
printed separately.
Reproduction of
the instrument
display for real-
time
measurements
Calibration data
for each
parameter
Functions
Visualization of acquired
data in table or graph

