XIIMUS R-GB-IR CL User Manual. Version 1.2
7.2
Selection of optics
The choice of optics affects the picture quality in terms of resolution, field of view, depth of
field and amount of lighting needed, just to name a few factors. The selection of optics can
have a dramatic effect on image quality. This is why a basic understanding of optics is re-
quired. A few guidelines are presented in this section. It is recommended to contact your
supplier or TVI Vision for advice on optics and lightning or to have them verified.
7.2.1
Modulation transfer function
Lens systems can vary notably in terms of image quality. Quality can be characterised in
terms of Modulation Transfer Function (MTF). MTF gives a measurement of how much
contrast is left between two details (usually black and white pairs of lines per mm) after they
have been projected. In general it is defined as fidelity of the image in comparison to the
object being imaged.
Maximum MTF is 1.0, but due to optical imperfections and diffraction, this is impossible to
reach. MTF at large apertures (f1.0-2.8) is limited by optical imperfections, which vary a lot
from lens to lens and manufacturer. At small apertures (f11 - f32+) lens performance is
limited more by diffraction than optical quality, so in this case there are minor differences
between lenses and manufacturers. Most lenses produce best results around aperture size
f8.
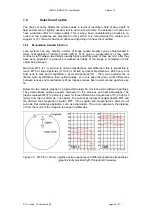
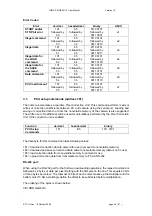
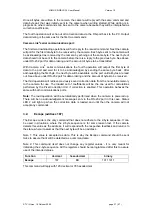
Below are two sample graphs of a typical fair quality 50 mm lens at two different apertures.
They demonstrate various aspects discussed in the previous and next paragraphs. The
graphs represent MTF in percent (y-axis) for three different line frequencies of 10, 20 and 40
lp/mm from top to bottom (lp = line pairs). The solid lines represent sagittal (radial) MTF and
the dashed lines tangential (circular) MTF. If the sagittal and tangential line pairs do not
coincide, this indicates aberration, such as astigmatism. The x-axis represents the distance
of from the centre of the image to the edge in millimetres.
Figure 7.3 : MTF for a 50 mm objective at two apertures and different spatial line frequencies
(graphs kindly provided by © Photodo AB, Sweden)
© TVI Vision, 18 October 2006 page 22 ( 57 )


