Pro-EC44 2-Loop Graphical Profile Controller & Recorder
Pro-EC44 Product Manual - 59540-2 September 2014
Page 59
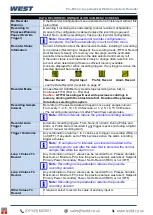
Activities To Record
Multiple process events can be recorded from: Alarm
n
Status (
n
= 1 to 7)
or Unit turned Off/On.
Note:
If an alarm changes state an extra sample is recorded
using extra memory. The remaining recording time is reduced
accordingly.
Profiler Events To
Record
The Profiler Event
n
Status can be recorded (
n
= 1 to 5).
Note:
If a profile event changes state an extra sample is
recorded using extra memory. The remaining recording time is
reduced accordingly.
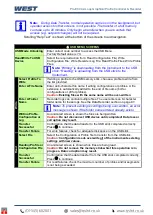
CLOCK CONFIGURATION SUB-MENU SCREENS
Date Format
w
The format used for all displayed dates:
dd/mm/yyyy
(
Day / Month / Year
)
or
mm/dd/yyyy
(
Month / Day / Year
).
–
Recorder versions only
.
Set Date
w
Set the internal clock Date
– Entered in the format defined by Date Format
screen.
–
Recorder versions only
.
Set Time
w
Set the internal clock Time. - In
hh:mm:ss
(
Hours : Minutes : Seconds
)
format.
–
Recorder versions only.
Note:
Clock settings cannot be changed when the data recorder is active.
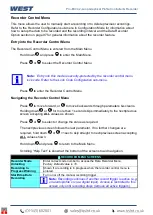
DISPLAY CONFIGURATION SUB-MENU SCREENS
Language
Select English or the alternate local language. The alternate language is
selected at time of order, but can be changed later using the PC software.
Enable Custom
Display Mode
Enables/disables the Custom Operation Mode, if configured. The screens
seen in this mode are configured using the PC configuration software.
Read Only Operation
Mode?
Allows Operation Mode to be Read/Write or Read-Only where screens can
be seen but the values cannot be changed.
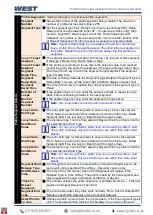
Display Colour
From: Red only; Green only; Red to Green on Alarm or Green to Red on
Alarm; Red to Green if Output Latched or Green to Red if Output Latched.
Invert Display
Standard or Inverted display image.
Display Contrast
Screen contrast (10 and 100) to improve clarity. 100 = maximum contrast.
Loop 1 Trend
Sample Interval
The Interval between the displayed values on the loop 1 trend graph.
From: Every 1; 2; 5; 10; 15; 30 Seconds, or 1; 2; 5; 10; 15; 30 Minutes.
-
Independent from the loop 2 trend graph and data recorder sample rates.
Loop 1 Trend View
Mode
The data to display on the loop 1 trend graph. From: Process Value only,
PV (solid) & SP (dotted) at sample time, or the Max & Min PV between
samples (candle-stick graph).
Alarm active indication is always shown at
the top of graph
.
Loop 2 Trend
Sample Interval
The Interval between the displayed values on the loop 2 trend graph.
From: Every 1; 2; 5; 10; 15; 30 Seconds, or 1; 2; 5; 10; 15; 30 Minutes.
-
Independent from the loop 1 trend graph and data recorder sample rates.
Loop 2 Trend View
Mode
The data to display on the loop 1 trend graph. From: Process Value only,
PV (solid) & SP (dotted) at sample time, or the Max & Min PV between
samples (candle-stick graph).
Alarm active indication is always shown at
the top of graph
.
Operator Visibility
Extra parameters can be made visible/adjustable in Operation Mode from:
Profile Control; Recorder Start/Stop; Recorder Status; Loop 1 & 2 Setpoint
Select; Loop 1 & 2 Auto/Manual Select; Loop 1 & 2 Control Select; Loop 1
& 2 Trend View; Loop 1 & 2 Setpoint Ramp Rate.
See
◘ in Operator Mode lists.
Summary of Contents for Pro-EC44
Page 1: ...Pro EC44 2 Loop Graphical Profile Controller Recorder Pro EC44 User Guide 59540 2 ...
Page 2: ......
Page 6: ......

