background image

WX-500-0317

© 2020 Wavetronix LLC. All rights reserved. Protected in the US by patents viewable at www.wavetronix.com/en/legal. Protected by Canadian Patent Nos. 2461411; 2434756; 2512689; and European Patent Nos. 1435036; 

1438702; 1611458. Other US and international patents pending. Wavetronix, SmartSensor, Click, Command and all associated logos are trademarks of Wavetronix LLC. All other product or brand names as they appear are 

trademarks or registered trademarks of their respective holders. Product specifications are subject to change without notice. This material is provided for informational purposes only; Wavetronix assumes no liability 

related to its use.

11

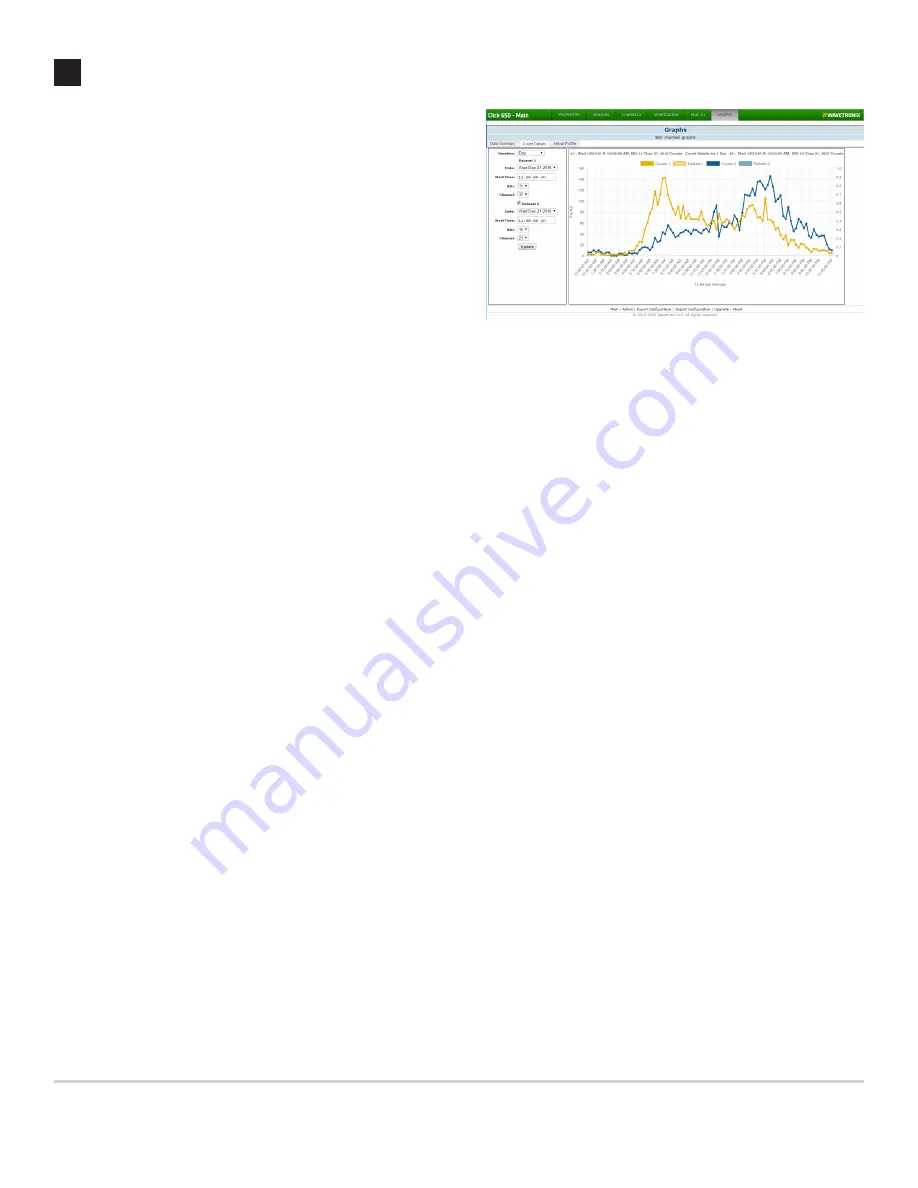
  Graphs

The

 Graphs

 tab can generate tables and graphs for volume and 

arrival on green data, based on the last week’s work of data:


˽

Under the 

Data Summary

 tab, you can view a table of 

counts and AoG% info for all currently mapped channels. 

Use the setting on the left to choose the time frame for 

which to show data.


˽

The 

Count Details

 tab generates a line graph showing 

counts over time on a given channel or channels. Use the 

settings on the left to choose the channel(s) and time frame.


˽

The

 Arrival Profile

 tab generates a bar graph showing the 

number of vehicles arriving on red vs. those arriving on 

green over time. Use the settings on the left to choose the 

channel and time frame.

Summary of Contents for Click 65 Series

Page 1: ...t There are a few ways you could do this Place the device on a shelf Order mounting brackets to mount the device on the side of the cabinet 3 Connect the SDLC cable 2 Terminate sensor cables Note The Click 650 and 656 are cabinet interface devices that provide power surge protection and communi cation to up to four 650 or six 656 SmartSensor Advance or Matrix sensors They provide better functional...

Page 2: ...onnect to the web interface 1 On the main screen navigate down to Network Setup and click the Accept green check mark button to open the networking screen shown at right 2 Set your desired IP address by following these steps use the left and right arrow keys to highlight a number then use the up and down arrow keys to change that number Then move to the next number Repeat until all the numbers are...

Page 3: ...map the incoming sensor channels from the attached sensors to outgoing detector channels Choose the appropriate BIU tab at the top of the screen Then for each outgoing detector channel left column that you want to map do the following 1 If desired change the phase number and description phase assignments are necessary to generate graphs discussed below 2 In the fifth column choose the sensor with ...

Page 4: ...ided for informational purposes only Wavetronix assumes no liability related to its use 11 Graphs The Graphs tab can generate tables and graphs for volume and arrival on green data based on the last week s work of data Under the Data Summary tab you can view a table of counts and AoG info for all currently mapped channels Use the setting on the left to choose the time frame for which to show data ...

Reviews: