Launching Xgig TraceControl
Chapter 3, Getting Started with Xgig TraceControl
Xgig Analyzer User’s Guide
25
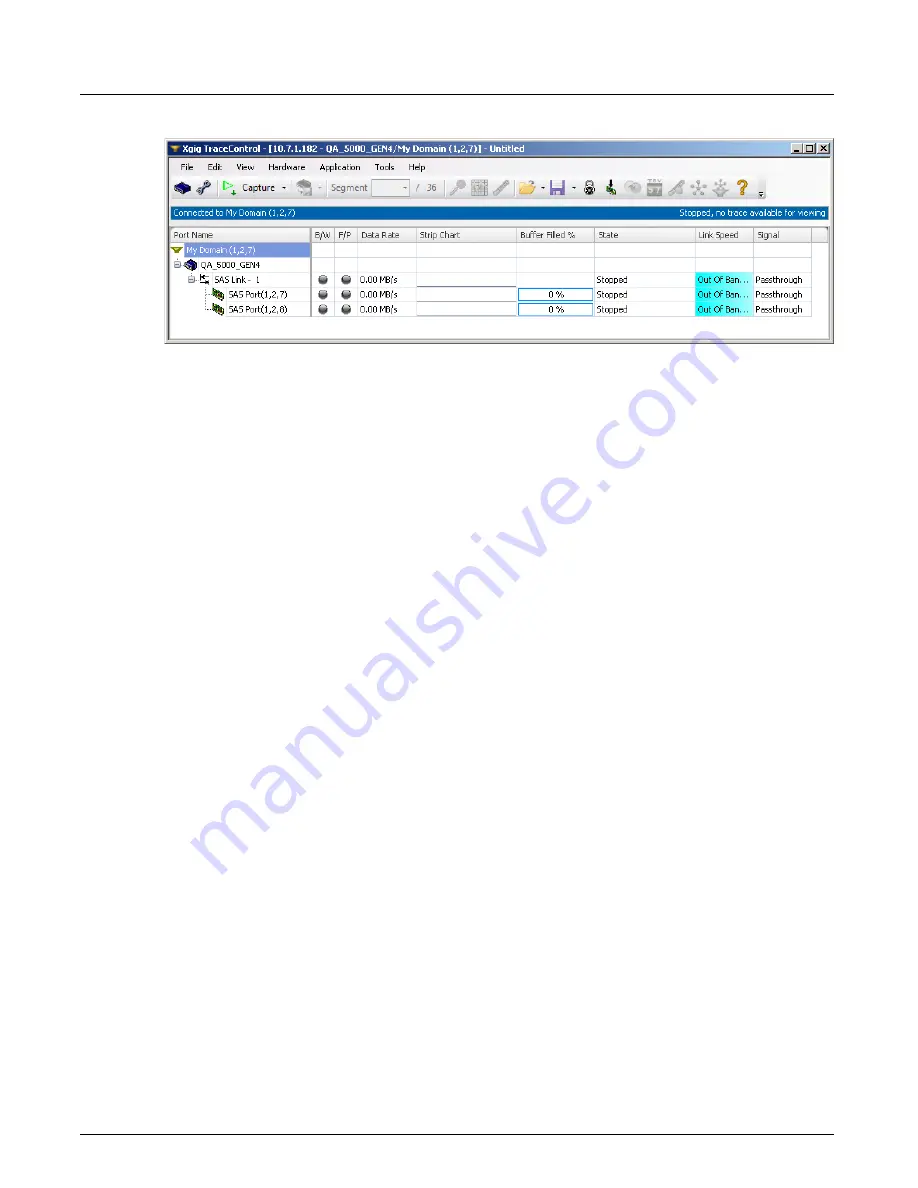
Figure 6: Link Monitoring in Port Status View
SFP and Power Monitoring in Port Status View
Some optional columns are available in the status view to obtain general information about SFPs
and to monitor the transmit and receive power for ports. These columns only display if you select
them by customizing the columns as described above. The default is to not display SFP diagnostic
fields.
The columns shown under
SFPs
only contain information for optical SFPs only. N/A is shown for
SAS or copper SFPs, or the field may be blank.
The columns shown under
40G SFPs
are for optical 40G SFPs. A set of diagnostic status fields
are available for each of the four 40G ports in an Xgig1000 chassis.
Power levels can indicate if signal levels are not strong or have degraded due to the
optical-electrical-optical pass-through process when the signal is passed through multiple
analyzers or taps.
SFP diagnostic status fields take some time to show values. Allow at least 5 seconds for values to
display in these columns, especially if you have many ports in the domain.
SFP RxPower
Shows the current power level for the receive port on the SFP. If no power level is reported by the
SFP, this field will show
N/A
.
SFP TxPower
Shows the current power level for the transmit port on the SFP. If no power level is reported by the
SFP, this field will show
N/A
.
SFP Make
Shows the vendor name of the SFP for each port. If no vendor is reported by the SFP, this field is
blank.
SFP Model
Shows the model number of the SFP for each port. If no model number is reported by the SFP, this
field is blank.
Summary of Contents for Xgig
Page 1: ...Xgig Analyzer Version 7 3 User s Guide ...
Page 2: ......
Page 3: ...Viavi Solutions 1 844 GO VIAVI www viavisolutions com Xgig Analyzer Version 7 3 User s Guide ...
Page 6: ...Xgig Analyzer User s Guide Page iv Version 7 3 December 2015 ...
Page 7: ...v CONTENTS ...
Page 15: ...1 PART ONE Using Xgig Analyzer ...
Page 16: ...PART ONE Using Xgig Analyzer 2 Xgig Analyzer User s Guide ...
Page 27: ...13 PART TWO Using Xgig TraceControl ...
Page 28: ...PART TWO Using Xgig TraceControl 14 Xgig Analyzer User s Guide ...
Page 29: ...15 Chapter 2 About Xgig TraceControl In this chapter Introduction to TraceControl ...
Page 176: ...Chapter 6 Xgig TraceControl Hints and Tips Keyboard Shortcuts 162 Xgig Analyzer User s Guide ...
Page 177: ...163 PART THREE Using Xgig Performance Monitor ...
Page 178: ...PART THREE Using Xgig Performance Monitor 164 Xgig Analyzer User s Guide ...
Page 223: ...209 PART FOUR Using Xgig TraceView ...
Page 224: ...PART FOUR Using Xgig TraceView 210 Xgig Analyzer User s Guide ...
Page 225: ...211 Chapter 11 About Xgig TraceView In this chapter Introducing Xgig TraceView ...
Page 382: ...Chapter 15 Xgig TraceView Histograms Histogram Controls 368 Xgig Analyzer User s Guide ...
Page 383: ...369 Chapter 16 Xgig TraceView Template Editor In this chapter Using Template Editor ...
Page 437: ...423 PART FIVE Using Xgig Expert ...
Page 438: ...PART FIVE Using Xgig Expert 424 Xgig Analyzer User s Guide ...
Page 442: ...Chapter 21 Xgig Expert 428 Xgig Analyzer User s Guide Figure 194 Xgig Expert Graph View ...
Page 443: ...429 PART SIX Appendices ...
Page 444: ...PART SIX Appendices 430 Xgig Analyzer User s Guide ...
Page 454: ...Appendix C Protocol Display Color Coding 440 Xgig Analyzer User s Guide ...
Page 461: ...447 INDEX ...
Page 467: ......


