Using the LTSSM Panes for PCIe
Chapter 14, Using the Secondary Panes in Xgig TraceView
Xgig Analyzer User’s Guide
361
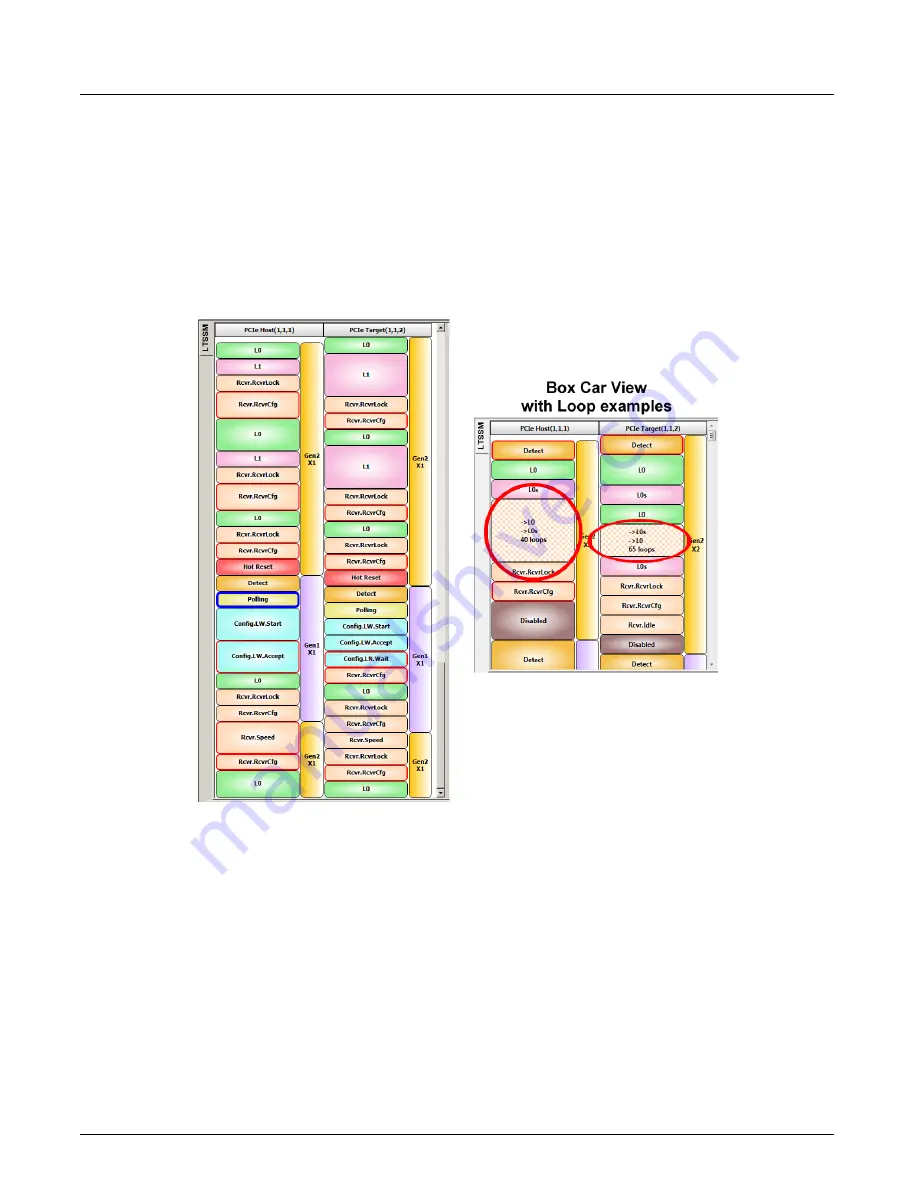
Box Car View
The Box Car view has a column for each side of the link – one for uplink and another for
downlink. Each column has two sub-columns that show LTSSM states and sub-states, and the link
speed (Gen1, Gen2, and Gen3) with the corresponding lane widths (X4 for example reflects 4
traffic lanes.) All the states in a column are shown in chronological order but their height is not
proportional to the time duration of each state. If a sequence is visited repeatedly, it is displayed as
a single bubble showing the states visited and the number of loops.
Figure 163: Box Car View
When you click on a state in box car view, it will be highlighted. Its corresponding state in
flowchart view will also be highlighted. The first event corresponding to the beginning of the state
will be highlighted in event grid and lane view grid. If a state's transition to the next state is invalid
according to protocol specification, a red border will be displayed around the state. You can mouse
over the states that have a red border to display a tooltip describing its invalid transition.
Also clicking the link speed with the lane width highlights the corresponding event in Event view
and Lane view which caused the speed and lane width change.
In the example shown on the right side of Figure 163, the highlighted bubbles show transitions that
are caught in a loop between two or more states. The states between which the loop is occurring
and the number of loops that occurred are displayed in the bubble. In this case (the red circle and
red oval), the looping is between L0 and L0s states and there are 40 loops in the PCIe Host column
and 65 loops in the PCIe Target column.
Summary of Contents for Xgig
Page 1: ...Xgig Analyzer Version 7 3 User s Guide ...
Page 2: ......
Page 3: ...Viavi Solutions 1 844 GO VIAVI www viavisolutions com Xgig Analyzer Version 7 3 User s Guide ...
Page 6: ...Xgig Analyzer User s Guide Page iv Version 7 3 December 2015 ...
Page 7: ...v CONTENTS ...
Page 15: ...1 PART ONE Using Xgig Analyzer ...
Page 16: ...PART ONE Using Xgig Analyzer 2 Xgig Analyzer User s Guide ...
Page 27: ...13 PART TWO Using Xgig TraceControl ...
Page 28: ...PART TWO Using Xgig TraceControl 14 Xgig Analyzer User s Guide ...
Page 29: ...15 Chapter 2 About Xgig TraceControl In this chapter Introduction to TraceControl ...
Page 176: ...Chapter 6 Xgig TraceControl Hints and Tips Keyboard Shortcuts 162 Xgig Analyzer User s Guide ...
Page 177: ...163 PART THREE Using Xgig Performance Monitor ...
Page 178: ...PART THREE Using Xgig Performance Monitor 164 Xgig Analyzer User s Guide ...
Page 223: ...209 PART FOUR Using Xgig TraceView ...
Page 224: ...PART FOUR Using Xgig TraceView 210 Xgig Analyzer User s Guide ...
Page 225: ...211 Chapter 11 About Xgig TraceView In this chapter Introducing Xgig TraceView ...
Page 382: ...Chapter 15 Xgig TraceView Histograms Histogram Controls 368 Xgig Analyzer User s Guide ...
Page 383: ...369 Chapter 16 Xgig TraceView Template Editor In this chapter Using Template Editor ...
Page 437: ...423 PART FIVE Using Xgig Expert ...
Page 438: ...PART FIVE Using Xgig Expert 424 Xgig Analyzer User s Guide ...
Page 442: ...Chapter 21 Xgig Expert 428 Xgig Analyzer User s Guide Figure 194 Xgig Expert Graph View ...
Page 443: ...429 PART SIX Appendices ...
Page 444: ...PART SIX Appendices 430 Xgig Analyzer User s Guide ...
Page 454: ...Appendix C Protocol Display Color Coding 440 Xgig Analyzer User s Guide ...
Page 461: ...447 INDEX ...
Page 467: ......


