


Chapter 4
Basic Testing
Step 5: Viewing test results
T-BERD/MTS/SC Getting Started Guide
Page 122
22046537, Rev. 016
March 2018
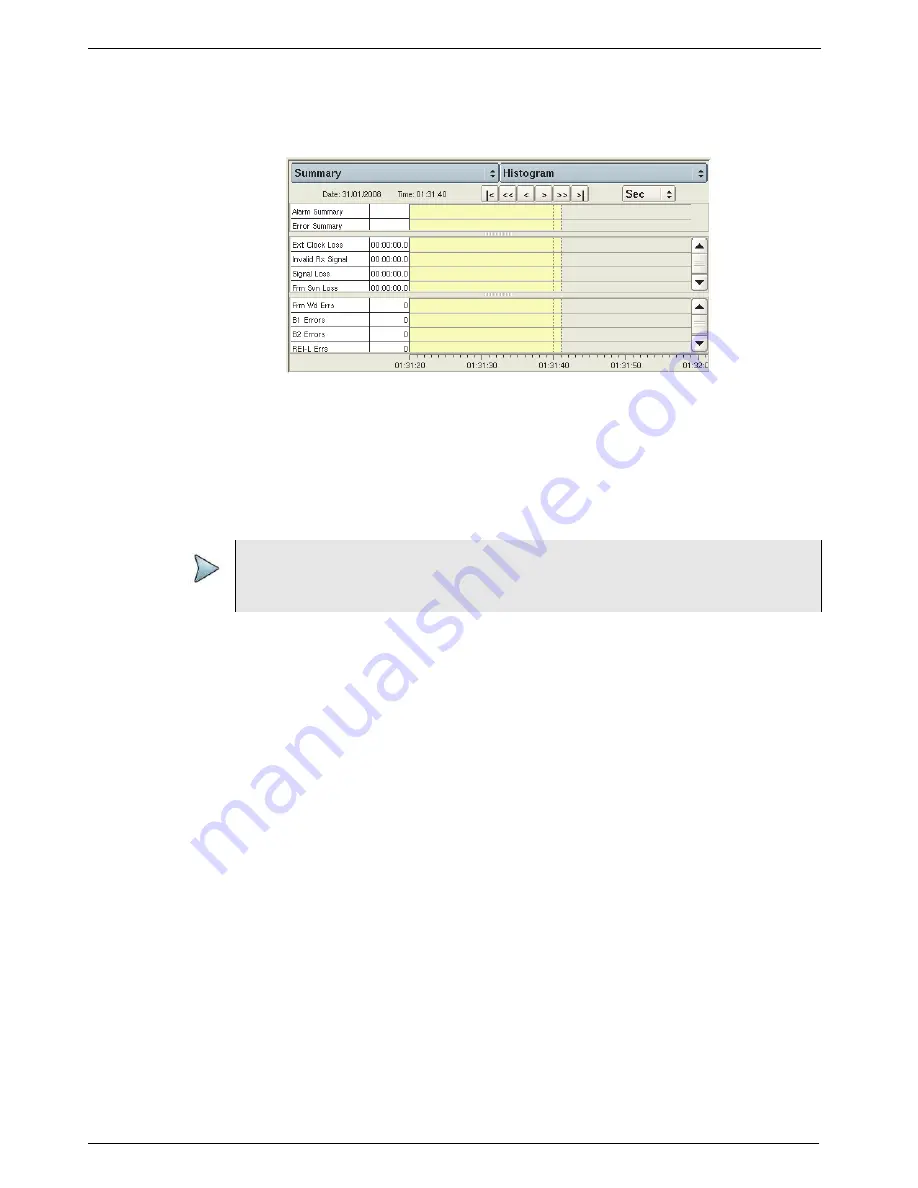
The Histogram display appears.
2
You can modify the default display as follows:
–
To view the complete histogram, select Full Size view (see
).
–
To scroll horizontally through the display, use the arrow keys at the top of the pane.
–
To change the histogram interval, select the arrow keys to the right of the interval button
(illustrated as “Sec” in
), and then select the new interval (Min, Hour, or Day).
About the Event log
An event log is a display listing any errors, anomalies, alarms, or defects that occur
during the course of your test. The log displays the value for each event, and provides
the date and time that the event occurred.
Viewing an event log
To view an event log
1
Select the Summary group, and then select the Event Log category.
Figure 69
Histogram display (full size)
NOTE:
Histograms are not available when running IP Video applications; however, an
event log is available.