E-24
3D Mapping Function
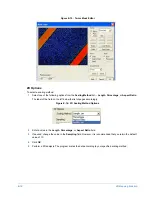
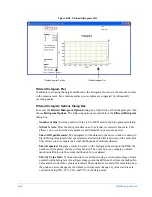
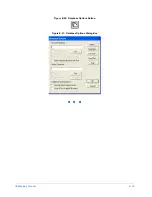
Figure E-21: Contour Plot Menu
2D Analysis
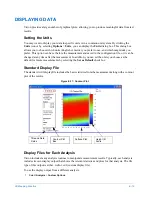
The 2D Analysis displays a contour plot and X and Y profile plots (see
. You can access
the 2D Plot by selecting
Analysis
>
2D Profile
,
Analysis
>
Custom Options
>
2D Plot
>
OK
, or by
clicking the
2D Analysis
). This option is available when a dataset is open.
NOTE –
When you open the results of a Dektak 150 scan in Vision, the program performs
2D-trace analysis on the data and displays it as a 2D plot similar to the one shown in
.
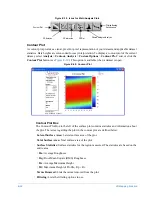
Figure E-22: 2D Analysis Plot
•
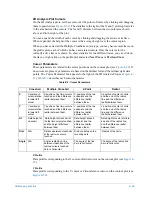
The 2D profiles correspond to the cursor positions on the contour plot. You can view different
profiles in the X and Y directions by moving the cursors on the contour plot. Point to the region
of interest and click the left mouse button or click and drag the cursors.
2D Analysis
Plot
Statistics
Cursors
Y Profile
X Profile
Contour Plot
on 2D
Cursor
Parameters
Summary of Contents for Dektak 150
Page 1: ......
Page 7: ......
Page 17: ......
Page 81: ......
Page 105: ......
Page 149: ......
Page 191: ......
Page 251: ......
Page 257: ...A 6 Facilities Specifications Figure A 6 Dektak 150 without Enclosure Side View ...
Page 258: ...Facilities Specifications A 7 Figure A 7 Dektak 150 Dimensions without Enclosure Top View ...
Page 259: ...A 8 Facilities Specifications Figure A 8 Dektak 150 without Enclosure Center of Mass ...
Page 273: ......
Page 283: ......
Page 321: ......
Page 331: ......
Page 333: ......
Page 336: ......
Page 337: ......
Page 349: ......

