


Multiple Scan Operation
5-31
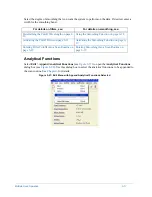
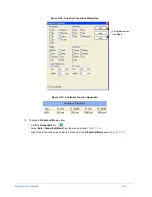
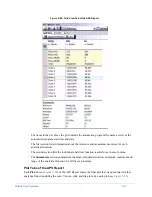
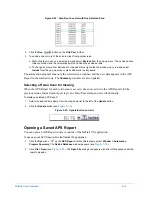
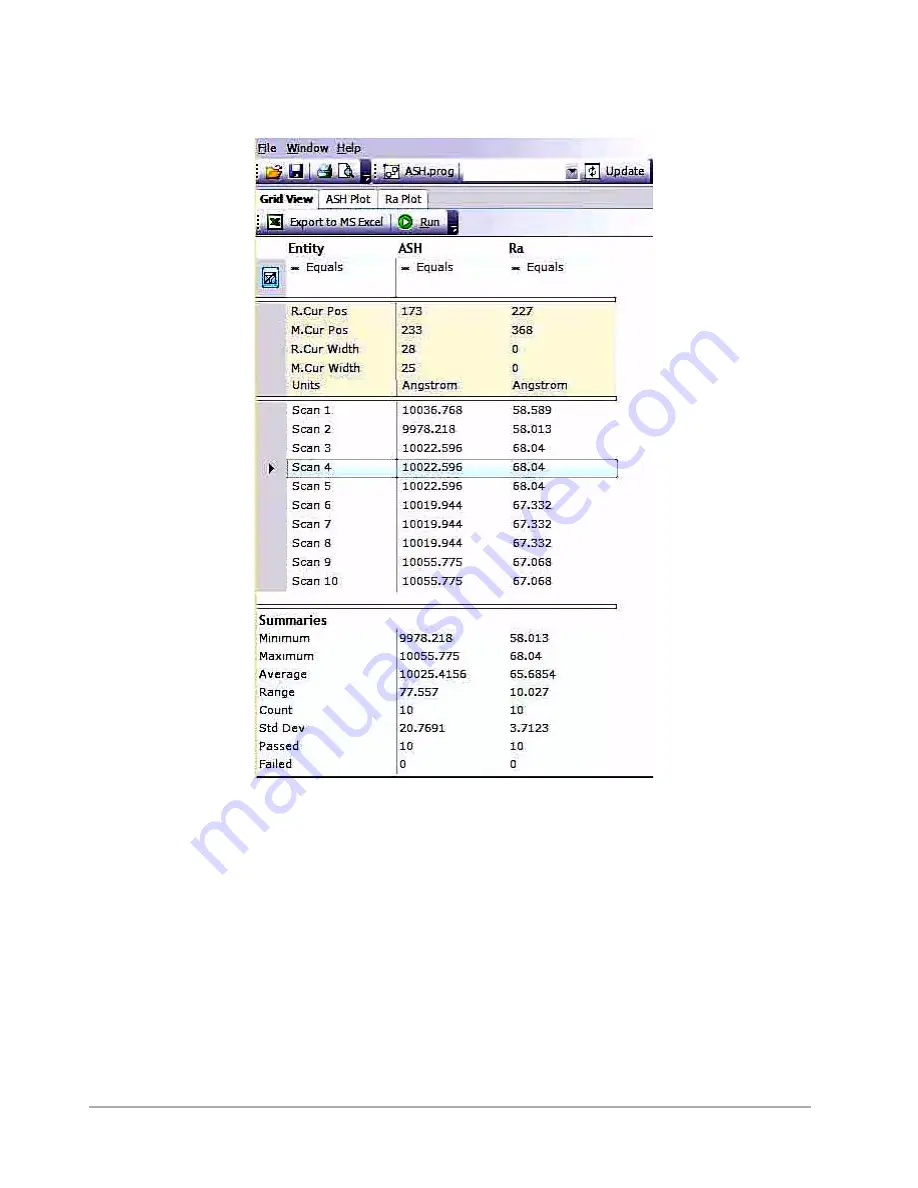
Figure 5-50: Grid View Tab of the APS Report
•
The items in the bar above the grid include the automation program file name as well as the
automation program start time and date.
•
The first section lists information about the reference and measurement cursors for each
analytical function.
•
The second section lists the individual analytical function results for each scan routine.
•
The
Summaries
section summarizes the mean, standard deviation, minimum, maximum and
range of the analytical function for all the scan routines.
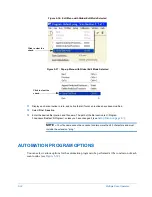
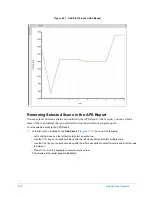
Plot Tabs of the APS Report
Each
Plot
) of the APS Report shows the final plot that was generated for that
analytical function during the scan. You can click and drag to resize each plot (see
).
Summary of Contents for Dektak 150
Page 1: ......
Page 7: ......
Page 17: ......
Page 81: ......
Page 105: ......
Page 149: ......
Page 191: ......
Page 251: ......
Page 257: ...A 6 Facilities Specifications Figure A 6 Dektak 150 without Enclosure Side View ...
Page 258: ...Facilities Specifications A 7 Figure A 7 Dektak 150 Dimensions without Enclosure Top View ...
Page 259: ...A 8 Facilities Specifications Figure A 8 Dektak 150 without Enclosure Center of Mass ...
Page 273: ......
Page 283: ......
Page 321: ......
Page 331: ......
Page 333: ......
Page 336: ......
Page 337: ......
Page 349: ......