


VANNER
Incorporated
VLT Series True Sine Wave Inverter - Owner’s Manual
10
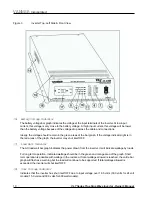
Figure 3
Inverter Top, Left Side & Front View
(6) Battery Voltage Indicator
The battery voltage bar graph indicates the voltage at the input terminals of the inverter. At low input
current, this voltage is very close to the battery voltage. At high input current, this voltage will be lower
than the battery voltage because of the voltage drop across the cable and connections.
Ideally, the voltage should remain in the green areas of the bar graph. If the voltage indicator light is in
the red areas of the graph, the inverter may shut itself OFF.
(7) Load Watt Indicator
The AC load watt bar graph indicates the power drawn from the inverter. It will indicate wattage by loads.
For long term operation, indicated wattage should be in the green and orange area of the graph. Short
term operation is possible with wattage in the red area. If total wattage allowed is reached, the entire bar
graph will flash as a warning but the load will continue to be supported. If total wattage allowed is
exceeded, the inverter will shut itself OFF.
(8) Over Voltage Indicator
Indicates that the inverter has shut itself OFF due to input voltage over 16.5 volts (33.0 volts for 24 volt
models; 15.0 volts and 30.0 volts for 600 watt models).


